Results from the 2012 60SecondScience Video Competition have been released. For the last two years 60SecondScience has been a global science event involving students and citizens from 40 countries. These citizen and student-created videos have been downloaded and viewed well over 700,000 times, and growing daily. The competition is sponsored by DEECD Victoria, Australia. Winners below share $10,000 in cash prizes in the 2012 Competition.
The 2012 Competition is now finalised and our 11 fabulous local and world judges have made their decisions. In 2013 the judging panel welcomes Richard Saunders and Dr. Rachael Dunlop. Judging criteria are based on science accuracy, communication and video production values.
With assistance from Emeritus Professor John McKenzie AM, the convenor presented Australian winners with awards last Friday 7 September at BMW Edge Theatre, Federation Square as part of the ICT Week Celebrations, opened by Victorian Minister for Technology Gordon Rich-Phillips.
The 2013 Competition opens for Registration and Uploads on 23 September 2012 and closes on 18 August 2013.
Karamoja region in northern Uganda is one of pastoral communities and closely dispersed ethnic groups that rely on livestock for their livelihood. It is within a semi-arid place like this that economies based on meat, milk, and blood from cattle thrive. In communities such as this one, cattle plague will always be the number one fear.
The morbillivirus rinderpest goes by many names — cattle plague in the old english or “loleoo
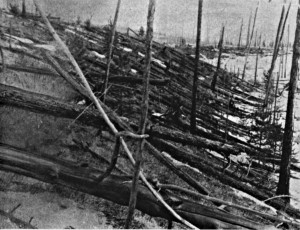
On June 30, 7.17am in a remote, sparsely inhabited area in Siberia, Russia, near the Podkamennaya Tunguska River, occurred an event of enormous devastation. An asteroid or comet estimated to be 40-50 meters in diameter, exploded at low altitude with an energy almost 200 times that of the atom bomb dropped on Hiroshima. Trees where knocked down over an area of two thousand square kilometres, hundreds of reindeer where killed and the seismic shock from the airborne explosion was registered on barometers in England. Eyewitnesses 60km away, reported seeing the northern sky covered with fire, followed by an enormous bang, though thankfully no human deaths were recorded.
Fallen trees at the Tunguska impact site
Dan Yeoman from NASA’s Jet Propulsion Laboratory stated in an interview in 2008, “the Tunguska event is of great importance not only because of the devastation caused to a thankfully remote area, but also as it is the only modern era event of this type where we actually have first-hand accounts.
September 7 2012 Cancer research has taken a major step forward in Victoria as the Victorian Cancer BioBank and BioGrid Australia join forces to improve bowel cancer management.
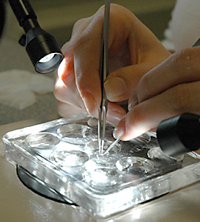
The collaboration allows researchers for the first time in Australia to access detailed data associated with tissue and blood samples.
Maureen Turner, CEO of BioGrid Australia, said today: ³Our collaboration opens up new possibilities, further strengthening the work that is underway to establish an integrated technology platform for cancer research in Victoria,² she said.
The Victorian Government announced in the 2012 Budget the development of an integrated cancer research platform under the umbrella of the Victorian Cancer Agency.
Bowel cancer research will be the first to benefit from the new association. Led by Dr Jeanne Tie, up to 13 sites are involved in the project, including clinicians from Royal Melbourne, Western, Austin and Box Hill Hospitals are examining whether circulating tumour DNA (ctDNA) is a reliable blood biomarker for the presence of colorectal cancer.
The clinicians are currently recruiting suitable participants for the study before taking serial blood samples.
Up to 900 blood samples over four years will be processed by Victorian Cancer Biobank staff across all four sites within three hours of collection. The plasma samples will be stored on ice before being shipped to the research laboratory for ctDNA analysis.
Dr Anne Thompson, CEO of the Victorian Cancer BioBank said: ³Interpreting the clinical usefulness of this biomarker relies on correlating ctDNA levels with the histopathology of the tumour, the treatment given to the patient and imaging results used to monitor effectiveness of treatment.²
³With the link now in place, researchers are able access secure, ethically approved data provided through BioGrid Australia to learn more about disease recurrence and survival.²
³This type of approach was not available before in Victoria, and it seemed logical to join forces for better cancer research results,² she added.
This new data linkage service between BioGrid and Biobank is available to all Australian researchers. The Victorian Cancer BioBank and BioGrid Australia chose bowel cancer as the first cancer to be supported through the collaboration because Australia has one of the highest rates of bowel cancer in the world and bowel cancer is the second most common type of newly diagnosed cancer and causes the second highest number of cancer deaths in Australia. Around 14,225 Australians are told they have bowel cancer every year but it is one of the most curable types of cancer if detected early, however, fewer than 40% of bowel cancers are detected early.
The collaboration has other immediate benefits for Victoria, according to Ms Turner. ³While Victoria is actively securing clinical trials to take place in Victoria, trials can and do have their limitations,² she said.
³For instance, often older or frail patients are excluded from trials leaving doctors uncertain as to whether trial results are relevant to many of the patients they see in routine practice.²
She says the approach that BioBank and BioGrid is taking ensures that biospecimens together with data will inform data analysis across all ages and stages of cancer through translational research projects and multi-centre clinical trials. ³What we have together is a very powerful draw card for attracting international research to Victoria, as larger numbers of patients participating in our services can be amassed more rapidly.²
BioGrid Australia
BioGrid Australia (www.biogrid.org.au) is an innovative health research platform that facilitates ethical privacy-protected research across many hospitals and medical research institutes. BioGrid provides a web-based Access Request System by which researchers can apply for access to specific databases. Sometimes additional ethics approval is required. Through this system, the data custodians authorise access to their data and a Scientific Advisory Committee assesses the proposed investigation.
Victorian Cancer BioBank
The Victorian Cancer Biobank is a not-for-profit consortium of tissue banks, supported by the Victorian government through the Victorian Cancer Agency. Our coordinated and integrated program collects and distributes tissue samples to researchers in Victoria, Australia and throughout the world. Our purpose is to provide high quality, ethically obtained biospecimens to support research that will lead to improvements in cancer diagnosis and treatment and deliver better clinical outcomes to people with cancer.
Media inquiries: Penny Underwood, MediaWise, on 03 9818 8540.
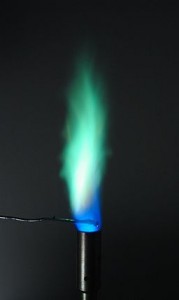
Gas flame used for flame test of copper sulphate. Photo Credit: Søren Wedel Nielsen
Imagination in Science
In my policy work in early childhood education, I get to travel and observe a few child care centers in the NYC area every year as part of our Excellence in Teaching Awards. Well, I should say I did, until the funding for this awards program was cut. Minor point.
In those visits last year, some really stellar (read well-funded) classrooms had water tables, sand boxes, aquariums, terrariums, birds, blocks, paints; tools to inspire and ignite the creativity of young minds as they explore and try to make sense of the world around them. Imagination is the most vivid and active during the early years. It must be cultivated and continued in practice.
Let’s think about the role of imagination in science. The process of imagination is on display everywhere in an early childhood classroom. But by the time they reach middle school, students seem to burn out and tire of science. Tired of memorizing facts and figures they see no point in bothering to retain because they will never use that information again. They see no purpose for being able to regurgitate that Cu is the symbol for the chemical element of copper; that 454 grams equals 1 pound; that kinetic energy is defined as the work needed to accelerate a body of a given mass from rest to its stated velocity. All of this information could be looked up if it were required in the future. Where is the imagination? What is driving the curiosity?
The United States is losing a great majority of future scientists as a result of its education system and the way it teaches science. It’s alarming when you hear the statistics: American students ranked 21st out of 30 in science, and 25th out of 30 in math compared to other students in developed countries (2006 PISA comparison). Or on the 2009 NAEP math test 4th graders showed absolutely no improvement in scores, while 8th graders showed modest progress at best. That’s why this emphasis on STEM – Science, Technology, Engineering and Mathematics – is so crucial. If we are to “stem” this brain drain of our youth, we must begin to see and teach science in a new light.
Why We Should Care
Science and math form the basis of our society. Who envisioned and built streets to make transportation easier, or built homes for improved shelter? That couldn’t have been done with basic principles and understanding of either science or math.
Think about who designed your Starbucks cup containing your triple soy latte this morning.* Or the person who envisioned the design of the clothes you are wearing and the manufacturing process that went into producing the items that fit your style. Or the energy and transportation logistics required to get those Levi’s into the stores for you to purchase.
Whether kids are interested in studying particle physics, fashion design, or aeronautical engineering in terms of a future career, doesn’t much matter. Society requires this mix of disciplines to function. And the teaching and promotion of science and technology, and the process we use in the curriculum to increase students’ interest and learning, is how we begin to turn this tide.
We need to show the applications of science to connect with children. Give them the means to see the direction of their studies laid out in front of them so that they can understand the relevant connections between classroom content and career pathways, thus providing learning opportunities for students.
I think we are not seeing the forest for the trees; we are more focused on getting to the endpoint – maintaining a competitive status, being a global leader, creating more jobs – than we are focused on how we get there along the way. Perhaps that is the missing component; something we should be sharing with children as we try and teach them about protons, electrons and neutrons. That if they can understand these concepts, understand the relationships, they may be better able to think about the application of these concepts into nuclear medicine and how it might lead to a career as in the field of molecular medicine, or they may apply this knowledge to working on nuclear-powered submarines.
We start our kids in gymnastics, karate, soccer (football) and rugby when young; why isn’t the same emphasis placed on science education in schools? Science is fun! But I’m wired differently and a bit of a nerd, so you may differ with my opinion (but you probably do not, since you are reading Australian Science). Kids don’t just like winning at sports, they like winning. There’s more to competition than just winning, of course: learning what went right, what went wrong, how to improve, working with others, pulling your own weight, being a leader – these are things important to competition, whether it is athletics or academics. And a healthy balance of the two is important.
Young muscle memory needs to be exercised early and often for excellence to take hold. But conditioning a young mind is different from pushing a young mind. Beginning down the path with the mindset that your young child is going to win the Nobel Prize in physics and anything less is unacceptable, probably isn’t ideal. But if parents and schools can start exposing kids to science at an earlier age – simple building blocks, water tables, modeling clay, activities requiring counting and measuring, nature trips. I’m talking things that are age appropriate of course, those activities that give kids a chance to explore on their own terms the world around them. Encouragement, support, resources – that’s how you grow a future scientist, that’s how you improve a nation, a society. Without science, what chance do we have as a species for survival?
In the U.S., much time and resources are spent on “teaching to the test”. Meaning, teachers are prepping their students for standardized tests. Not munch learning is taking place as little information is retained that way. Would it be better to have a two-week “camp
August was a momentous month for science and technology. In my top five events are: NASA landed a car-sized rover on Mars; the first man to walk on the Moon, Neil Armstrong dies; Harvard scientist create a cyborg tissue; Swedish researchers detail how Parkinson’s disease spreads through the brain; and Voyager 2 turns 35.
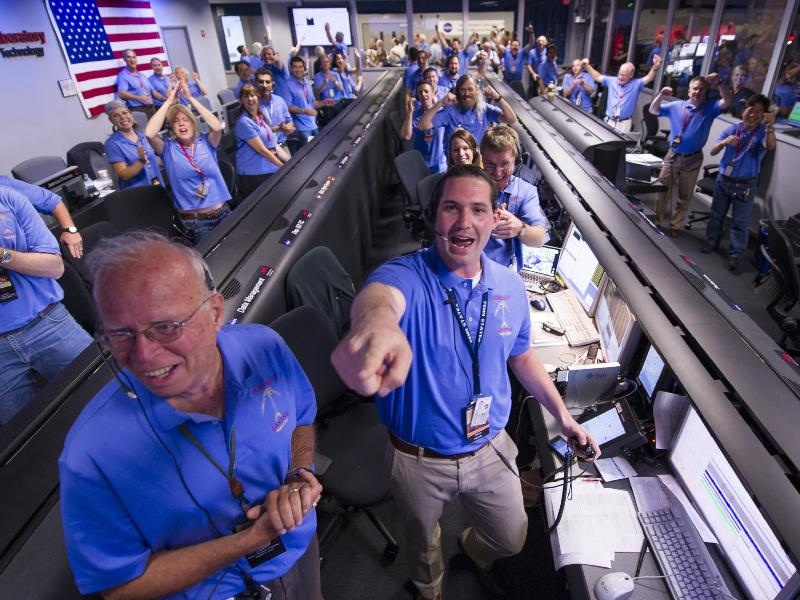
Without a doubt the technology achievement of the month goes to NASA. They landed the rover, Curiosity, successfully on Mars at 1:31 a.m. EDT August 6, 2012. Ending a 36-week flight and beginning a two-year investigation. What makes this noteworthy? For one the coverage and access NASA provided in real time. From the launch to the daily updates to the ‘on the spot’ coverage of the entrance-descent-landing sequence live from the Pasadena control-room. Showing that engineers and scientists are human after all.
I was delighted to see the sky-crane landing working to perfection. As the system were all bought to life one-by-one the science exploration staff are eagerly anticipating zapping, sampling and analysing rocks, regolith and atmosphere.
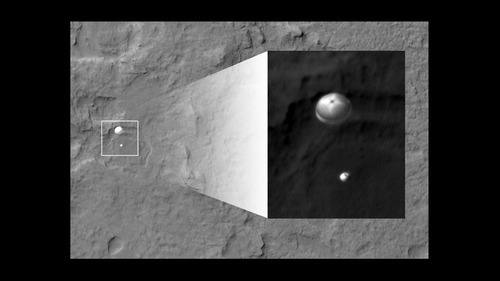
Curiosity parachuting to the Martian surface. Photo credit NASA/JPL.
“Today, the wheels of Curiosity have begun to blaze the trail for human footprints on Mars. Curiosity, the most sophisticated rover ever built, is now on the surface of the Red Planet, where it will seek to answer age-old questions about whether life ever existed on Mars, or if the planet can sustain life in the future,” said NASA Administrator Charles Bolden. “This is an amazing achievement, made possible by a team of scientists and engineers from around the world and led by the extraordinary men and women of NASA and our Jet Propulsion Laboratory. President Obama has laid out a bold vision for sending humans to Mars in the mid-2030’s, and today’s landing marks a significant step toward achieving this goal.”
The bold vision for sending humans to Mars was poignant. Neil Armstrong, the first man to walk on the moon during the 1969 Apollo 11 mission, died, following complications resulting from cardiovascular procedures. He was 82. Without a doubt Neil Armstrong, Buzz Aldrin and Michael Collins were childhood heroes to me. They along with the other astronauts of both the Apollo and Gemini missions were a key inspiration in firstly my interest in and secondly my career in science.
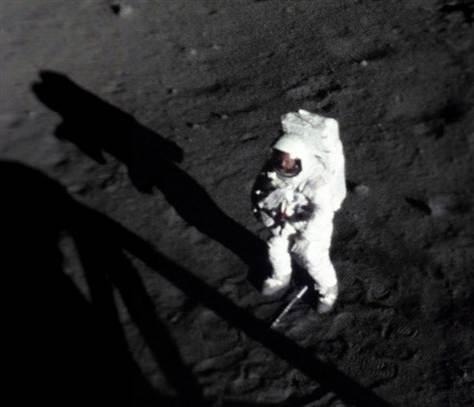
The only picture taken of Neil Armstrong on the Moon. Neil was carrying the camera (seen in his hands here) during the entire moon-walk so all images captures Buzz Aldrin. This image was captured by a stationary camera on the Lunar landing module. Image credit NASA.
“Houston, Tranquillity Base here. The Eagle has landed,” Armstrong said, telling a tense and waiting Earth that men had finally reached the lunar surface. Neil Armstrong was also a reluctant American hero who always believed he was just doing his job. A refreshing change from the current days of hyped useless celebrities and where the word awesome is applies to every mundane activity. Traveling to the Moon, that inspires a sense of awe.
Meanwhileresearchers at Harvard have grown cyborg tissues with embedded nanoelectronics. They have reported how they developed a system for creating nanoscale “scaffolds” which could be seeded with cells which later grow into tissue.
Though a number of potential applications exist for the technology, the most near-term use may come from the pharmaceutical industry. Researchers could use it to more precisely study how newly developed drugs act in three-dimensional tissues, rather than thin layers of cultured cells. The system might also one day be used to monitor changes inside the body and react accordingly, whether through electrical stimulation or the release of a drug.
Parkinson’s researchers at Lund University for the first time were able to follow events in which misfolded proteins travel from sick to healthy cells. This model has never before been identified so clearly in a living organism. The experiments also show how the transferred proteins attract proteins in the host cell leading to abnormal folding or “clumping” inside the cells. This is a cellular process likely to lead to the disease process as Parkinson’s progresses, and it spreads to an increasing number of brain regions as the patient gets sicker.
The aim of the research is to better understand how Parkinson’s pathology progresses and thereby uncover novel molecular targets for disease-modifying treatments.
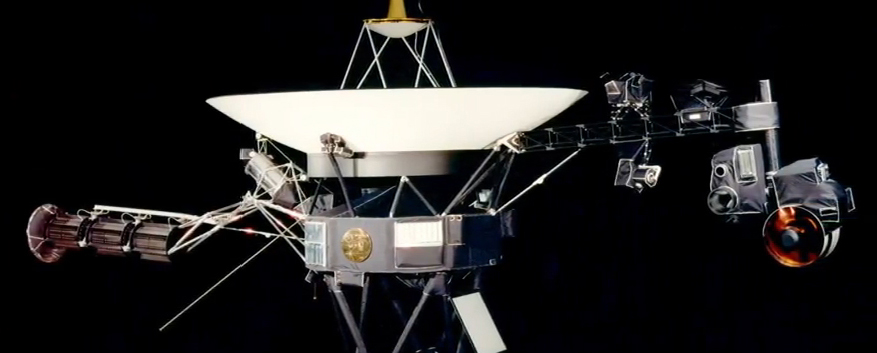
Voyager 1. Image credit NASA/JPL
Finally what an inspiring longevity story. Thirty-five years ago, NASA’s Voyager 2 spacecraft, the first Voyager spacecraft to launch, departed on a journey that would make it the only spacecraft to visit Uranus and Neptune and the longest-operating NASA spacecraft ever. Voyager 2 and its twin, Voyager 1, that launched 16 days later on Sept. 5, 1977, are still going strong, hurtling away from our sun. Mission managers are eagerly anticipating the day when they break on through to the other side – the space between stars.
I trust you have enjoyed my idiosyncratic “five best new science and technology” stories of this past calender month. These were in most cases, but not exclusively so, announced through peer reviewed journals. These were those that I found most interesting, or influential, or of possible future impact. No science applied to my choice, the choice was my responsibility alone!
Scientists often exercise a certain detachment when doing their work. I’ve often seem friends and colleagues get “lost in the numbers” and forget precisely what it is they’re looking at and what those numbers actually mean. However, in some cases this may not be a bad thing. For instance, in the analysis of conflict data.
Putting aside any personal reactions and moral implications of what you’re really looking at may not be easy for everyone, but analysis of conflict data is important in predicting the behaviour of wars and potentially minimising risks and harm in the future. Technology is marching on, and as a result the amount of data being collected from war zones is huge. With the state of social media, internet resources like Twitter and Facebook have proven to be valuable sources of information, providing a quick way to share information with people trapped in the middle of troubled areas – a remarkably significant use which I’m sure no one could have ever predicted when these services originally started up. The problem for researchers lies in how exactly to use that data. Constructing a model of how a conflict will unfold and making predictions from it may be vital in stopping things from escalating out of control. Unfortunately, such predictions aren’t easily made.
The idea that the movements of masses of people could be predicted is not a new one. In fact, in his typically insightful manner, the idea was first devised by Isaac Asimov who created the fictional science of psychohistory, featured in his 1951 novel Foundation. Asimov’s ideas weren’t without firm basis in reality, and while the details may be different, it seems like the concept of psychohistory may not be quite so fictional after all.
Predicting the Afghan War Diaries
The Afghan National Army at Kabul Military Training Centre (2009)
Between then, a group of researchers based in Edinburgh and Sheffield in the UK and New York decided to try a different approach. They noted that most of the data analysed previously didn’t go beyond simply visualising what had been seen and recorded. Actual predictions had proved too challenging, not least because it hadn’t been clear how to actually model the data available.
This group of researchers, led by Guido Sanguinetti, constructed a set of methods to use statistical dynamic modelling to make predictions on conflicts such as the recent war in Afghanistan. They needed to look at the times and locations, as well as how information was transported from place to place. They decided that the best way to analyse how a conflict unfolded was to treat it the way other researchers model environmental events and the spread of infectious diseases. In many ways, these events proceed in ways very similar to outbreaks of violence during conflicts.
In this case though, Sanguinetti and his colleagues had an ace up their sleeve. Courtesy of the now infamous whistleblowers at WikiLeaks, a huge disclosure of US military logs from the Afghan conflict had been made in 2010. Known as the Afghan War Diary, this set of records drew a lot of attention internationally on its release and also served to be the ideal way of testing the effectiveness of any predictions. Essentially, Sanguinetti and the others could use their models to make predictions on the conflict and then check against the released reports to see how accurate they’d been.
Conflict climates
Remarkably, based entirely on written reports between 2004 and 2009, they were able to predict with impressive accuracy, what events would occur in 2010. In short, using nothing but some clever mathematics, the researchers could tell what would likely happen next. Where conflicts would increase in intensity and where things would remain quiet. And this isn’t even a comprehensive model yet. There are many adjustments which can still be made to improve the accuracy still further. Even accounting for sudden changes, like the dramatic increase of US forces in Afghanistan in 2010, the predictions remained accurate. Evidently, events will continue unabated despite any large military offensives which may be taking place.
The war in Afghanistan has not been of the traditional type between two armies. Instead, the conflict there has been irregular, involving a huge number of loosely connected groups. This may be the reason why a relatively simple model works so well in predicting the behaviour of those groups – where and when violence would escalate. This sort of behaviour is typically the sort that large scale armies have trouble in countering due to the lack of any centralised organisation. Mathematically speaking, it genuinely becomes a lot like trying to predict the weather.
To me, this kind of work offers some hope in resolving serious conflicts as quickly as possible. Being a pacifist myself, I abhor violence of any kind, and the ability to predict and avoid any serious bloodshed is certainly a good thing. Whatever your feelings on it, the ability to predict violence in conflict situations the same way meteorologists predict the weather has some potentially very useful possibilities.
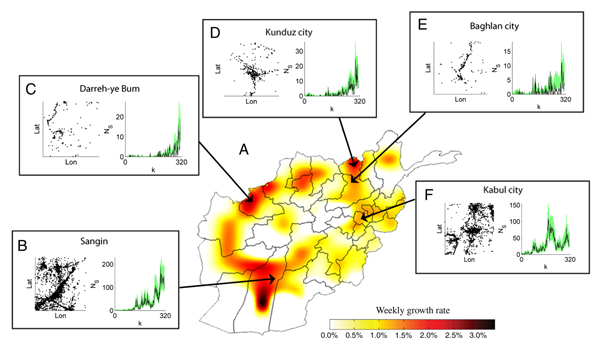
A visualisation of the increasing number of events recorded in the Afghan War Diaries (A) compared with predictions of events occurring (B-F).
An international group of researchers announced in the journal Nature that they had succeeded in creating tin-100. This experiment helps us understand how heavy elements have formed. A few minutes after the Big Bang the universe contained no other elements than the lightest; hydrogen and helium.
We, the objects around us, the Earth and the other planets all contain heavier elements; carbon, oxygen, silicon, tin, iron etc. These elements came into existence later than hydrogen and helium. They formed through the fusion of atomic nuclei inside of stars. Elements heavier than iron owe their existence to gigantic stellar explosions called supernovas. Tin-100 is a very unstable, yet important, element for the understanding the formation of these heavier elements.
The inspiration of creating new elements can be traced to alchemical traditions. Alchemy is an arcane tradition, that can be viewed as a proto-science, a precursor to chemistry and nuclear physics. It’s prime objective was to produce the mythical philosopher’s stone, which was said to be capable of turning base metals into gold or silver, and also act as an elixir of life that would confer youth and immortality upon its user.
The Alchemist, 1771 painting by Joseph Wright of Derby. Image credit: Wikipedia, image copyright has expired.
It did bring to chemistry many ideas and provided procedures, equipment, and terminology that are still in use. It also provided the inspiration for the creation of new elements. Now we understand to create new elements requires a combination of precision equipment and experimental procedures coupled with a sound understanding of quantum theory.
So what is tin-100 and why is it useful to understand the astrophysics of heavy element formation?
Most people will recognise that matter around us is composed of atoms. Atoms of carbon, hydrogen, oxygen for example form the building blocks to make organic molecules and silicon and oxygen bond together to make common beach sand and are fused together to make glass. The familiar metals are solids made of one type of atom, for example gold and aluminium, or combinations, bronze being made of copper and tin atoms.
Atoms in turn are a central nucleus of protons and neutrons surrounded by a swarm of electrons. The number of protons distinguishes one element from another. This atomic number is used to designate an element 1 for hydrogen, 8 for oxygen and 50 for tin, for example. Stable tin comprises 112 nuclear particles – 50 protons and 62 neutrons. The neutrons act as a kind of buffer between the electrically repelling protons and prevent normal tin from decaying. Each atom will contain an equal number of electrons to its protons. Remove or add an electron and the atom becomes an ion, a charged particle.
The strange quantum world of the nuclei
Quantum mechanics which, amongst other things, explains how the electrons form into shells around the nucleus. Elements which have filled outer shells, helium, neon, argon, xenon are ‘noble’ gases, chemically inert – not the least reactive. Nuclei are also complex quantum objects.
As far as we know, nuclei are the smallest objects that can be split up into their constituents. They are therefore the smallest entities which emergent properties – patterns that arise from complexity – can be studied. Nuclear scientists study these emergent phenomena and are using them to decipher the nature of the nuclear force. In contrast to the structure of atoms, for which the fundamental interaction between the electrons and the nucleus – the electromagnetic force – is known with great precision, the interaction between the nucleons – the strong nuclear force – is not so well known.
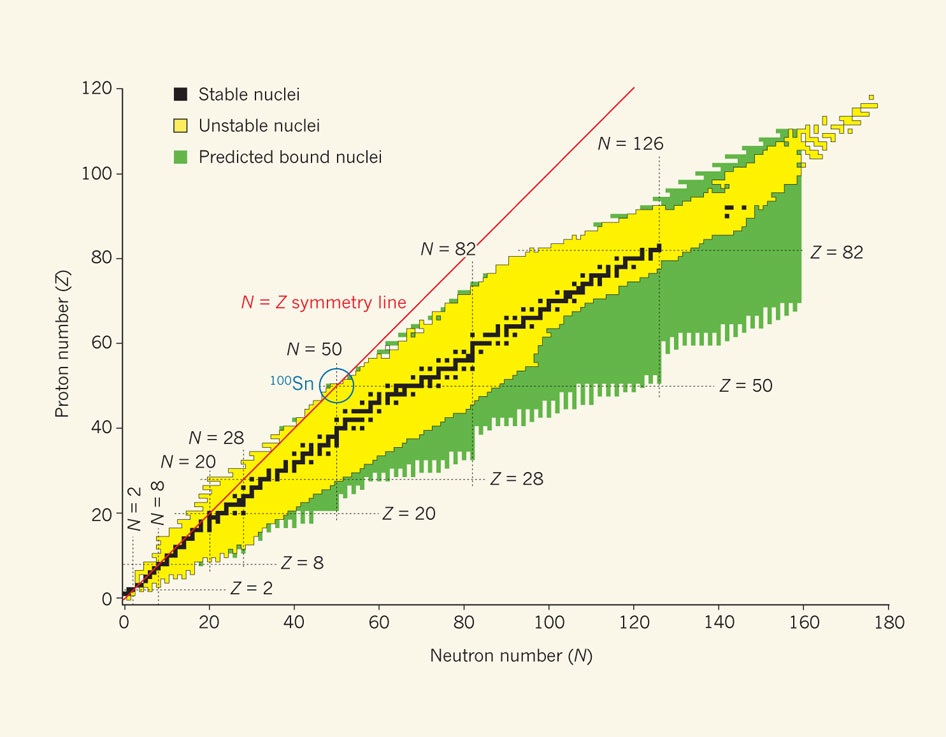
In nature not all combinations of nucleons are stable. As a general rule the more protons present then more neutrons are required to stablise the nuclei. A useful graphical presentation of this is the Segre table of radionuclides.
Location of nuclei as a function of their neutron number (N) and proton number (Z). Image credit Daniel Bazin Michigan State University.
If the shell structure of electrons was difficult at first for scientists to come to terms with, then the shell structure exhibited by nucleons is not only unexpected it is complex enough not to be discussed in many quantum physics texts. It was first thought that such densely packed and strongly interacting objects as the nucleons would exhibit a liquid-like behavior, much like the flow of electrons in a good conductor such as a metal.
That is what makes these experiments so exciting.
Stability and magic numbers
Magic numbers are the number of protons or neutrons that form full shells in an atomic nucleus. The term is thought to have been coined by the physicist Eugene Wigner. The model has been used to explain – at least for stable nuclei – the observed sequence of magic numbers: 2, 8, 28, 50, 82 and 126.
Nuclei that have a magic number of neutrons or protons are more tightly bound than there non-magic counterparts. This intrinsic simplicity makes them prime candidates for testing proposed models of nuclear structure. Even more attractive are the doubly magic nuclei. The lighter nuclei helium-4, oxygen-16 and calcium-40 do follow the magic number sequence.
However because of the repulsion between protons the line of stable nuclei veers away from the symmetry line. As a result tin-100 represents the largest nuclei to follow the sequence. It is bound but unstable. It is very close to the edge of nuclear stability, where the nuclear force between the protons and neutrons can no longer bind them into a nucleus. Unfortunately, what makes this nucleus so attractive to study is what also makes it so difficult.
How to make a new element
In nature elements heavier than iron come into being only in powerful stellar explosions – supernovas. These include, for example, the precious metals gold and silver and the radioactive uranium. The cauldron of a supernova gives rise to a whole array of high-mass atomic nuclei. these decay to stable elements via different short-lived intermediate stages.
There are two ways to create new elements in the laboratory. The first is is to fuse two nuclei in a manner that minimises the loss of protons or α-particles (helium-4 nuclei). The second is is more brutal, fragmenting a small part off a heavier nuclei in a collision.
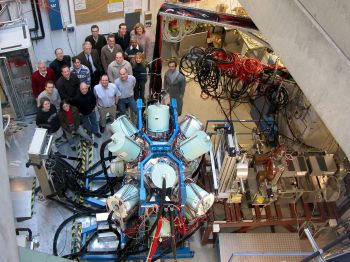
The detector set-up at GSI. Photo credit: GSI
In these experiments energetic xenon-124 is sheared by making it collide with a target beryllium foil leaving a residue that is composed of 50 neutrons and 50 protons. Out of the 120,000,000,000,000 xenon-124 accelerated in the experiment, only 259 tin-100 nuclei were identified. These results were sufficient though for the decay of tin-100 to be studied with great precision.
The results, excitedly for the researchers, demonstrated a ‘superallowed Gamow-Teller decay‘. This type of β-decay is beyond the scope of this essay to explain, needless to say it does provide new experimental depth to the models of nuclear chemistry. It is an important decay transition that occurs in the collapse of supernovae. It also is important in putting boundaries on the possible mass of the neutrino. Both of which are important validations of the current nuclear theories as well as providing real experimental data to fine tune the theoretical models.
This allows more real models of nuclear synthesis to be constructed. Allowing a deeper understanding of how the atoms that make up our universe were created.
Now other laboratories around the world will work on improving the production rates of tin-100 and other exotic nuclei, based on these experiments. Allowing the emergent properties of these nuclei can be studied in more detail. Giving us greater understanding of the forces that bind these particles together – to make us!
[Johannesburg, South Africa –23 August 2012] – The Internet Society announced that it has been selected by the African Union (AU) to conduct community mobilization and technical aspects workshops to support the establishment of Internet Exchange Points (IXPs) in AU Member States as part of the African Internet Exchange System (AXIS) project. The AXIS project aims at keeping Africa’s Internet traffic local to the continent by providing capacity building and technical assistance to facilitate the establishment of National Internet Exchange Points and Regional Internet Exchange Points in Africa. The project is funded by the Euro-Africa Infrastructure Fund and the Government of Luxembourg.
The Internet Society is committed to organizing 60 community mobilization and technical aspects workshops in 30 African countries. To this effect, the Internet Society will also contribute its own resources for the implementation of this component of the AXIS project.
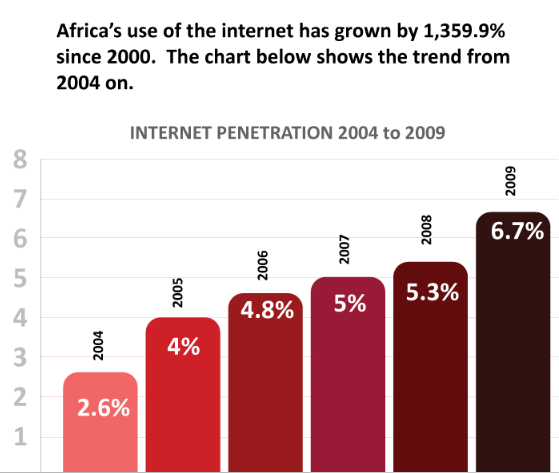
Africa's use of the internet by Jon Gosier (Flickr)
Currently, much of Africa’s Internet traffic is routed through Internet exchange points external to the African continent. As countries establish their own IXPs, Internet traffic will be routed locally, creating a downward pressure on costs and stimulating growth in and distribution of local Internet content. Through the AXIS project, the interests of the AU and the Internet Society, working with other African Internet organizations such as AfriNIC, AfNOG and AftLD, will be realized in this collaborative effort to assist in the development of a more locally operated and, hence, more robust and economically accessible pan-African Internet.
Moctar Yedaly, Head of Information Society Division, African Union Commission, commented, “Africa is paying overseas carriers to exchange ‘local’ (continental) traffic. This is both a costly as well as an inefficient way of handling inter-country exchange of Internet traffic. Independent analysis has shown that Africa pays over US$600 Million to developed countries every year for inter-African traffic exchange that is carried outside the continent. We are therefore pleased that the African Internet Exchange System project will address this challenge by facilitating optimization of Internet traffic to support intra-continental traffic flows in Africa.
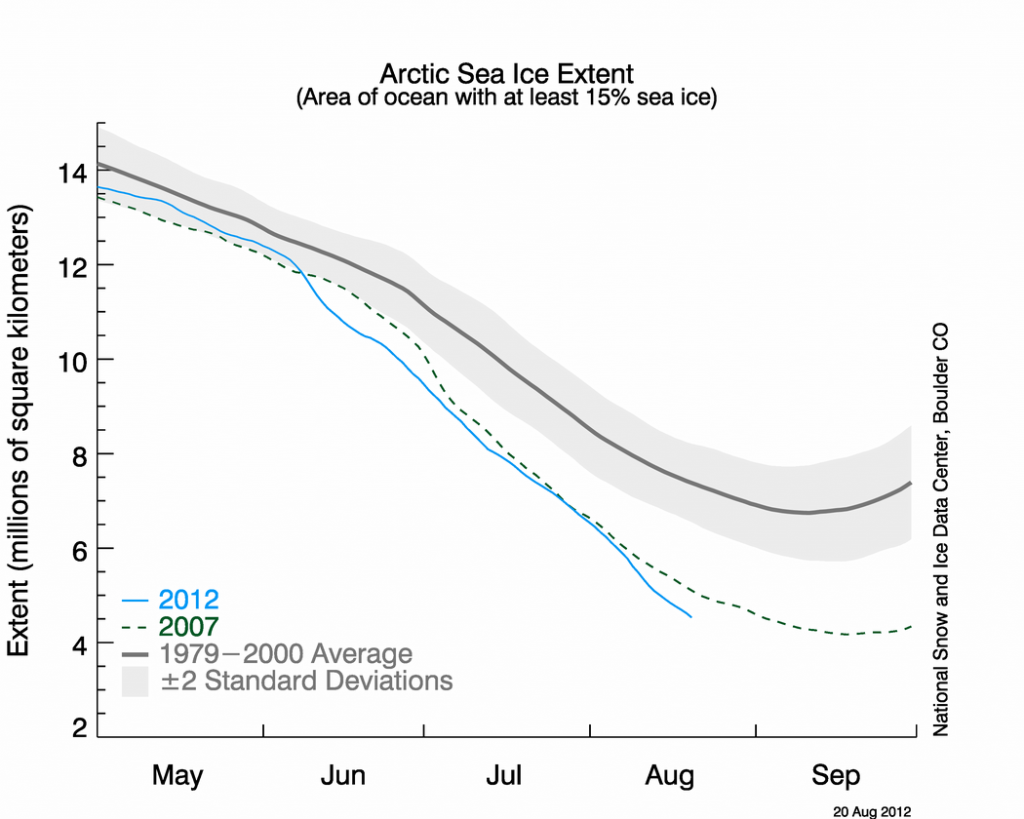
The plot is from US National Snow and Ice Data Center (NSIDC) and shows the Arctic sea ice extent data for the melt seasons of 2007 and 2012 alongside the 1979-1999 average. 2007 was a record low year, but with about three weeks of melt season left it looks likely that 2012 will set a new and decisive record low. While individual years have a small degree of variation, overall the long term trend is quite markedly downwards.
There is a design and principle on which to earth functions.
The world needs to review its knowledge base, its functioning, in terms of energy to matter ratio that earth strives to maintain. Unless we awaken to understand the energy cycle in which we live and how earth is designed to sustain certain ratio of energy to matter, we are doomed for huge destruction. The increasing heat in the environment is creating disorder. Time earth gets to convert heat into biological mass is critically reduced. Consequently disorder is peaking stressing every ecological system and life in it. Noble Laureate James Lovelock has predicted destruction through increasing heat. We need to quickly evolve in our understanding of nature to survive on earth. Some organization or institution and the media should take up to awaken the world – read a small article and awaken and call the world’s attention – “Critical Thinking on Global Warming and Increasing Climate Catastrophes” by John Paily http://www.scribd.com/doc/101836445
NASA’s rover Curiosity was safely on Mars. It was a perfect landing. The novel sky-crane method had proved its detractors wrong and its designers right. What was needed then was signs that Curiosity was working as designed. NASA had said that the first pictures may be anything up to 2 hours after landing. A long time for the audiences, waiting, live, all over Earth.
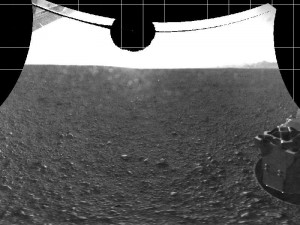
It's a wheel on Mars. Photo credit NASA/JPL
“Got thumbnails.” Pause in the control centre, then someone else yells “Its a wheel, its a wheel!” “A wheel on Mars!” For the second time that momentous afternoon the NASA/Jet propulsion Lab crowd erupted into spontaneous and joyful applause. Not only had they landed the rover, Curiosity, safely on Mars, they had received the first images back from its cameras. Sometimes the unscripted, unexpurgated exclamations make for the best history.
The first two pictures were from the front and back navigation cameras. They were low resolution black and white thumbnails taken through the dust caps that protected the cameras during landing. As the minutes ticked by higher resolution images came through from the rover. The business as usual, familiar image enhancement bought into sharp clarity the ‘first’ two images from the robot explorer.
The 'first' image enhanced view from the rear hazard camera, Mars Curiosity Sol 0.
The first week on Mars
After the exuberance and press conference came the trademark NASA precision and methodical approach. An approach that gets missions safely to Mars, at the same time can make the audacious appear mundane.
Mission controllers at NASA’s Jet Propulsion Laboratory in Pasadena, are now checking out Curiosity’s subsystems and 10 instruments. Curiosity is in the opening days of a two-year mission to investigate whether conditions have been favorable for microbial life and preserving clues in the rocks about possible past life.
Mission team members are “living” on Mars time. A Martian day is approximately 40 minutes longer than an Earth day, meaning team members start their shift 40 minutes later each day.
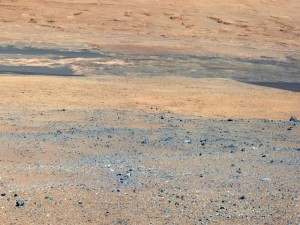
View of Mount Sharp, Curiosity's roving destination. Image credit NASA/JPL
Amongst the important system events in this first week was a software upgrade. It took four days to successfully upgrade Curiosity’s software in its main and back-up computer. The software had been uploaded during its trek to Mars, but not activated until now. The software to date was focused on getting Curiosity through the Martian atmosphere and safely to its destination in Gale Crater. The software upgrade is to cover its surface exploration activity, roving and controlling the various scientific instruments.
Curiosity Ready to Roll
“There will be a lot of important firsts that will be taking place for Curiosity over the next few weeks, but the first motion of its wheels, the first time our roving laboratory on Mars does some actual roving, that will be something special,” said Michael Watkins, mission manager for Curiosity from the Jet Propulsion Laboratory.
Mission engineers are devoting more time to planning the first rove of Curiosity. In the coming days, the rover will exercise each of its four steerable (front and back) wheels, turning each of them side-to-side before ending up with each wheel pointing straight ahead. On a later day, the rover will drive forward about one rover-length 3 metres, turn 90 degrees, and then kick into reverse for about 2 metres. Exciting times for the rover driver team!
This image shows the landing site of NASA's Curiosity rover and destinations scientists want to investigate. Photo credit NASA/JPL
The scientists and engineers of NASA’s Curiosity rover mission have selected the first driving destination for Curiosity. The target area, named Glenelg, is a natural intersection of three kinds of terrain. The trek to Glenelg will send the rover 400 metres east-southeast of its landing site. One of the three types of terrain intersecting at Glenelg is layered bedrock, which is attractive as the first drilling target.
The choice described by Curiosity Principal Investigator John Grotzinger of the California Institute of Technology as, “With such a great landing spot in Gale Crater, we literally had every degree of the compass to choose from for our first drive.” “We had a bunch of strong contenders. It is the kind of dilemma planetary scientists dream of, but you can only go one place for the first drilling for a rock sample on Mars. That first drilling will be a huge moment in the history of Mars exploration.”
Grotzinger estimated the rover’s journey would take between three weeks and two months to arrive at Glenelg, where it will stay for roughly a month before heading to the base of Mount Sharp.
It may be a full year before the remote-controlled rover gets to the base of the peak, which is within 20 kilometres of the rover’s landing site.
Zapping rocks and doing science
Before Curiosity heads off to Glenelg another first will occur. The team in charge of Curiosity’s Chemistry and Camera instrument, is planning to give their mast-mounted, rock-zapping laser and telescope combination a thorough checkout. ChemCam has “zapped” its first rock in the name of planetary science. It was the first time such a powerful laser has been used on the surface of another world.
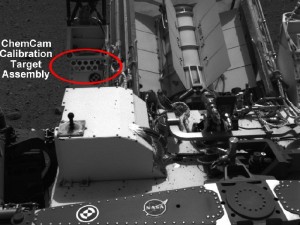
The Chemistry Camera calibration target, as seen by the camera. Photo credit NASA/JPL.
The technique is called ‘laser-induced breakdown spectroscopy’. The high-powered, narrow-focused, laser beam vaporises the rock from a distance generating a plasma plume with temperatures in excess of 100,000°C. At the high temperatures during the early plasma, the vaporised material breaks down into excited ionic and atomic species. As it cools to 5,000–20,000°C the characteristic atomic emission lines of the elements can be recorded by the camera. This data is compared to the ‘standards’ that the rover carries to identify the rock components.
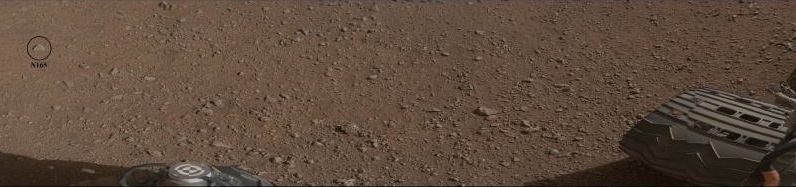
The soon to be famous rock N165, target for testing the Chemistry Camera laser and analysis. Photo credit NASA/JPL.
As Roger Wiens, principal investigator of the ChemCam instrument from the Los Alamos National Laboratory explained earlier, “Rock N165 looks like your typical Mars rock, about three inches wide. It’s about 10 feet away.” “We are going to hit it with 14 millijoules of energy 30 times in 10 seconds. It is not only going to be an excellent test of our system, it should be pretty cool too.”
Pretty cool indeed.
First weather report in 30 years
It is currently just above freezing point in gale Crater where Curiosity is.
Grotzinger noted the team’s report on the Martian crater’s temperature was “really an important benchmark for Mars science”.
“It’s been exactly 30 years since the last long duration monitoring weather station was present on Mars,” when Viking 1 stopped communicating with Earth in 1982,” he said. Then Viking 1 lander recorded temperatures that varied from −17.2 °C to −107 °C.
Sensors on two finger-like mini-booms extending horizontally from the mast of NASA’s Mars rover Curiosity will monitor wind speed, wind direction and air temperature. One also will monitor humidity; the other also will monitor ground temperature. The sensors are part of the Rover Environmental Monitoring Station, provided by Spain for the Mars Science Laboratory mission.
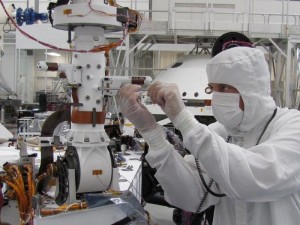
The weather station devices on Curiosity being tested prior to launch. Photo credit NASA/JPL.
In this image, the spacecraft specialist’s hands are just below one of the Rover Environmental Monitoring Station mini-booms. The other mini-boom extends to the left a little farther up the mast.
As Curiosity’s primary mission is for a full Martian year it will be able to record the seasonal variations that occur for Mars.
On the ground radiation monitoring and weather conditions will be crucial for any future exploration or habitation by humans. This mission by Curiosity represents an important step towards these aspirations.
“…the last big outbreak I experienced in Uganda [was] in 2007. When MSF arrived a lot of the staff in the hospital had died and the rest had run away because they were scared.
Remember those toy trucks, the 18-wheelers (tractor-trailers) that gas companies manufactured? If you grew up in the 80’s, and were a boy or had a brother, or just loved trucks, your dad probably bought one for Christmas. My brother and I would build towns out of Lincoln Logs and Legos and we would wait for the weekly delivery of gasoline from my brother’s Amoco truck to our “town’s

 OPEN DIVISIONS



 The collaboration allows researchers for the first time in Australia to access detailed data associated with tissue and blood samples.