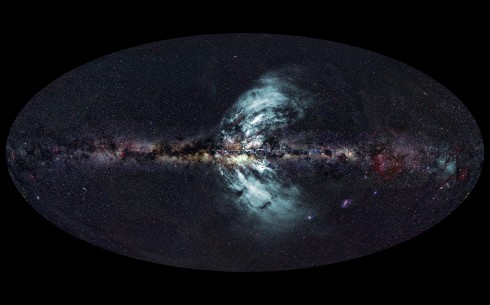
This shows the geysers (in blue) shooting out of the Milky Way. Credit: Optical image A. Mellinger, U.Central Michigan; radio image E. Carretti, CSIRO; radio data S-PASS team; composition E. Bresser, CSIRO
“Monster” outflows of charged particles from the centre of our Galaxy, stretching more than halfway across the sky, have been detected and mapped with CSIRO’s 64-m Parkes radio telescope. Corresponding to the “Fermi Bubbles” found in 2010, the outflows were detected by astronomers from Australia, the USA, Italy and The Netherlands. The finding is reported in the Jan 2 issue of Nature.
“These outflows contain an extraordinary amount of energy — about a million times the energy of an exploding star,” said the research team’s leader, CSIRO’s Dr Ettore Carretti.
But the outflows pose no danger to Earth or the Solar System.
The speed of the outflow is supersonic, about 1000 kilometres a second. “That’s fast, even for astronomers,” Dr Carretti said. “They are not coming in our direction, but go up and down from the Galactic Plane. We are 30,000 light-years away from the Galactic Centre, in the Plane. They are no danger to us.”
From top to bottom the outflows extend 50,000 light-years [five hundred thousand million million kilometres] out of the Galactic Plane. That’s equal to half the diameter of our Galaxy (which is 100,000 light-years — a million million million kilometres — across).
Seen from Earth, the outflows stretch about two-thirds across the sky from horizon to horizon. The outflows correspond to a “haze” of microwave emission previously spotted by the WMAP and Planck space telescopes and regions of gamma-ray emission detected with NASA’s Fermi space telescope in 2010, which were dubbed the “Fermi Bubbles.”
The WMAP, Planck and Fermi observations did not provide enough evidence to indicate definitively the source of the radiation they detected, but the new Parkes observations do.
“The options were a quasar-like outburst from the black hole at the Galactic Centre, or star-power — the hot winds from young stars, and exploding stars,” said team member Dr Gianni Bernardi of the Harvard-Smithsonian Center for Astrophysics, in Cambridge, Massachusetts. “Our observations tell us it’s star-power.”
In fact, the outflows appear to have been driven by many generations of stars forming and exploding in the Galactic Centre over the last hundred million years.
The key to determining this was to measure the outflows’ magnetic fields.
“We did this by measuring a key property of the radio waves from the outflows — their polarisation,” said team member Dr Roland Crocker of the Max-Planck-Institut fuer Kernphysik in Heidelberg, Germany, and the Australian National University.
The new observations also help to answer one of astronomers’ big questions about our Galaxy: how it generates and maintains its magnetic field. “The outflow from the Galactic Centre is carrying off not just gas and high-energy electrons, but also strong magnetic fields,” said team member Dr Marijke Haverkorn of Radboud University Nijmegen in The Netherlands.
“We suspect this must play a big part in generating the Galaxy’s overall magnetic field.”
By now, I think it’s safe to say that if you’re reading this, it means the world didn’t end on Friday. Which is rather a good thing, because a lot of interesting things have been happening recently! Even though I’ve been busy as can be, writing papers and trying to finish off a thesis there have still been a few fascinating little gems to catch my eye in the news this week…
Firstly, NASA have announced a new prototype space suit, with new and improved technology. Intended to be easier to put on, amongst other things, the most exciting part of the news is that these new suits are intended for deep space missions, focussing on safety “during spacewalks and potential surface activities”! Oh, but there’s just one thing which everyone’s noticed…
Nasa’s New Space Suit Looks Exactly Like Buzz Lightyear
Nasa said one of the key differences was that the new suit has a one-piece design, into which the wearer crawls in through a hole in the back, as opposed to the trousers-top-helmet version currently in use on the International Space Station.
Meanwhile, in Switzerland, physicists have been puzzled by the results they’ve seen from the LHC. While there’s now little doubt that they’ve detected a signature which matches what they’d expect from “a Higgs-like boson”, it seems like there’s more going on than they realised…
Two Higgs Bosons? CERN Scientists Revisit Large Hadron Collider Particle Data
Yesterday researchers at the Atlas experiment finally updated the two-photon results. What they seem to have found is bizarre—so bizarre, in fact, that physicists assume something must be wrong with it. Instead of one clean peak in the data, they have found two.
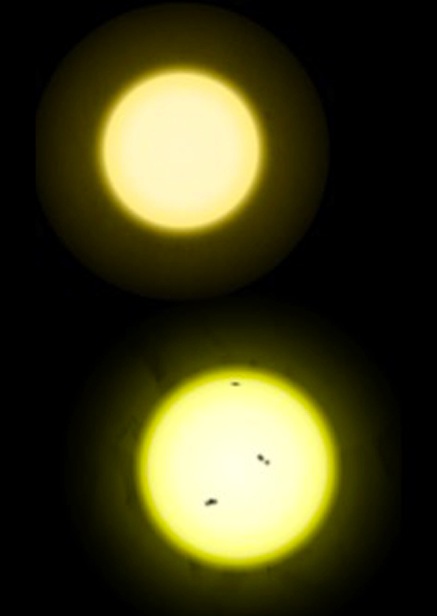
The Sun, is slightly larger and more active than Tau Ceti. Credit: R.J. Hall/Wikimedia Commons
Finally, one star near to Earth which has always garnered much attention from science fiction writers is Tau Ceti – right in our neighbourhood at a mere 12 light years away. For a long time, many have speculated on the potential for life-sustaining worlds around the Sun’s slightly more orange neighbour, and now it looks like there may well be. While we’re still waiting for confirmation, there may be 5 planets around Tau Ceti, and two of those might be candidates for sustaining life!
Nearby Tau Ceti may host two planets suited to life
The highlight of this alien solar system is Tau Ceti e, which has a mass of over four Earths and a year just under half as long as ours. It orbits in the star’s habitable zone, the region where liquid water is thought to exist. “It is in the right place to be interesting,” says [Hugh] Jones.
Short but sweet, that’s all for this week. I hope everyone has a lovely Christmas (or whichever of this season’s holidays and festivals you choose to celebrate). See you next time!
The genes of long-living and virus resistant bats may provide clues to the future treatment and prevention of infectious diseases and cancer in people, the Commonwealth Scientific and Industrial Research Organization ( CSIRO), Australia’s national science agency, said in a report on Friday.
This research, published in the journal Science, was a global effort involving researchers from China, Australia, Denmark, the United States and Singapore. It provides an insight into the evolution of bat’s flight, resistance to viruses and relatively long life.
Researchers at CSIRO and the Beijing Genome Institute led a team sequencing the genomes of two bat species – an Australian mega bat, the black flying fox, and a Chinese micro bat, David’s Myotis. They then compared the bat genomes to those of eight other mammals, including humans, to find similarities and differences.
“A deeper understanding of these evolutionary adaptations in bats may lead to better treatments for human diseases, and may eventually enable us to predict or perhaps even prevent outbreaks of emerging bat viruses,” said Dr. Chris Cowled, post-doctoral fellow at CSIRO’s Australian Animal Health Laboratory.
“Bats are a natural reservoir for several lethal viruses, such as Hendra, Ebola and SARS, but they often don’t succumb to disease from these viruses. They’re also the only mammal that can fly, and they live a long time compared to animals similar in size,” he said.
The research also reaffirms bats’ ancient and important place in the eco-system, particularly as pollinators and controlling insect numbers.
It’s that time again! Time for Weekly Science Picks! Let’s dive in.
This is interesting. This could really make things interesting. You just need to read this article on climate change and emissions that appeared in The Australian. It opens up a whole can of worms for debate, which I may tackle later, so feel free to leave a comment. I’d love to hear some thoughts on this.
“We can’t be allowed to free ride off the suffering of others,” he said yesterday. – John Connor, chief executive, Climate Institute
This is one of those stories that gets you excited and makes you wish you were part of that research team on assignment. I am anxiously awaiting the results. Earlier this week, drilling began at Lake Ellsworth in Antarctica. This project is testing the environments of where life is possible and has implications for future space exploration and discovery.
“Exploring for life in such an extreme environment – in pitch-black conditions under high pressure beneath the ice-sheet – could open up possibilities for life on other worlds such as Jupiter’s moon Europa.” – Professor Martin Siegert, chief scientist
There’s so much focus and emphasis on space these days, that we forget about that big blue thing that covers 71% of our planet and is in need of some major TLC…ah, the ocean! The Argo data program started in the late 1990s and has since been put to use in weather and climate models. It’s also playing a major role in ocean forecasting, such as responding to environmental emergencies, helping the shipping industry and promoting safety at sea.
“The world’s deep ocean environment is as hostile as that in space, but because it holds so many clues to our climate future exploring it with the Argo observing network is a real turning point for science. – Dr Susan Wijffels, Argo co-Chair and CSIRO Wealth from Oceans Flagship scientist
And tying it all back to the source of what’s important, the kiddos. This last pick comes from one of our very own Australian Science authors, Danielle Spencer. Here Danielle examines the importance of play-based learning in the science classroom.
Play-based learning is highly sanctioned in early year’s curriculum, but why do we need to stop? Ask any child who doesn’t like science and it’s about too much writing, too much theory, too much bookwork. Maybe, we just should let them play some more.
Stay thirsty for knowledge, my friends. Stay thirsty.
An innovative global observing system based on drifting sensors cycling from the surface to the ocean mid-depths is being celebrated by scientists today after reaching a major milestone – one million incredibly valuable ocean observations.
12 December 2012
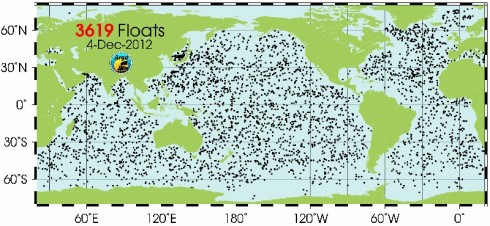
Global locations for Argo robotic sensors – 4 December 2012.
From 10 drifting robotic sensors deployed by Australia in the Indian Ocean in late 1999, the international research program has been quietly building up a global array which is now enabling new insights into the ocean’s central influence on global climate and marine ecosystems.
The initial objective was to maintain a network of 3000 sensors, in ice-free open ocean areas, providing both real-time data and higher quality delayed mode data and analyses to underpin a new generation of ocean and climate services. The program is called Argo.
“Argo data is now also being widely used in operational services for the community, including weather and climate prediction and ocean forecasting for environmental emergency response, shipping, defence, and safety at sea.” Dr Susan Wijffels, Argo co-Chair, CSIRO Wealth from Oceans Flagship scientist
“We’re still about 50 years behind the space community and its mission to reach the moon,” says Argo co-Chair and CSIRO Wealth from Oceans Flagship scientist, Dr Susan Wijffels.
“The world’s deep ocean environment is as hostile as that in space, but because it holds so many clues to our climate future exploring it with the Argo observing network is a real turning point for science.
“In its short life the Argo data set has become an essential mainstay of climate and ocean researchers complementing information from earth observing satellites and uniquely providing subsurface information giving new insights into changes in the earth’s hydrological warming rates and opening the possibility of longer term climate forecasting,” Dr Wijffels said.
Although the one millionth profile of the upper ocean, measured from the surface to a depth of two kilometres, was achieved in early November, oceanographers around the world are today celebrating this critical benchmark in ocean monitoring which delivers data to a scientist’s desk within 24 hours of sampling.
Celebrations included a series of high-level international presentations by senior scientists involving Dr Wijffels, her Argo co-Chair Prof Dean Roemmich from Scripps Institution of Oceanography, oceanographer Dr Josh Willis from the NASA Jet Propulsion Laboratory, and Dr Jim Cummings from the US Naval Research Laboratory.
The Argo array has risen to now number more than 3500 sensors, the largest there has ever been. The average lifetime of the floats has improved in the past decade greatly increasing the efficiency of the operation.
Presently 28 countries contribute to the annual A$25M cost of operating the program. The US is the largest provider of sensors to the network, with Australia, led by CSIRO with the Integrated Marine Observing System and the Bureau of Meteorology, maintaining more than 300 profilers for deployment mainly in the Indian and Southern Oceans, and Tasman Sea.
The 1.5 metre tall robotic sensors cycle vertically every 10 days, sampling temperature and salinity. At the surface, the sensors despatches its data via satellite to national centres across the globe, where analysts then check it, package it and send it to synchronous assembly centres in France and the US. The sensor’s ascent and descent is regulated by a hydraulic pump, powered with lithium batteries. Their life expectancy is between 4-9 years, averaging more than 200 profiles per sensor as they drift with the currents and eddies.
Data are collected at the impressive rate of one profile approximately every four minutes, (360 profiles per day or 11000 per month) and on 4 November 2012 Argo passed the symbolic milestone of collecting its one millionth profile. To put this achievement in context, since the start of deep sea oceanography in the late 19th century, ships have collected just over half a million temperature and salinity profiles to a depth of 1km and only 200000 to 2km. At the present rate of data collection Argo will take only eight years to collect its next million profiles.
Dr Wijffels said almost 1200 scientific papers based on or incorporating Argo data have been generated since the start of the program. Prominent findings include:
Analysis of ocean salinity patterns that suggests a substantial (16 to 24%) intensification of the global water cycle will occur in a future 2° to 3° warmer world.
A more detailed view of the world’s largest ocean current, the Antarctic Circumpolar Current.
An insight into changing bodies of water in the Southern Ocean and the way in which carbon dioxide is removed from the atmosphere.
Isolating the effect of ocean warming and thermal expansion on the global energy and sea level budget.
Dr Wijffels said Argo data is now also being widely used in operational services for the community, including weather and climate prediction and ocean forecasting for environmental emergency response, shipping, defence, and safety at sea.
Science Sunday! Our recurring collection of some of the week’s blogs and science articles that you may have missed.
World AIDS Day
The month of December begins, as it always does, with World AIDS Day. A day to raise awareness about HIV/AIDS and demonstrate international solidarity in the face of the pandemic. A day to reflect on how much we have accomplished and how much is still left to be done. Our very own Rayna Stamboliyska, writing in Future Challenges, asks the question “when will we live in an AIDS-free world?
Brussels, 6 December 2012 — Breaking new ground in providing access to the most comprehensive technological information, the European Patent Office (EPO) and the State Intellectual Property Office of the People’s Republic of China (SIPO) today launched the Chinese-English component of the EPO’s free automatic translation service Patent Translate.
As a result, the collections of the two largest languages in patents are now united as full-text documents on the same website through the EPO’s global patent database, Espacenet, and linguistically accessible for innovators from both regions using a single tool, Patent Translate. Under the new arrangement with SIPO, Espacenet has grown by 4 million Chinese language documents, adding to the 75 million documents already available.
Making the announcement at the annual bilateral meeting of the two offices in Brussels today, EPO President Benoît Battistelli said: “The launch of the Chinese-English machine translation tool opens a new dimension in patent information. Thanks to the close relations between the EPO and SIPO, millions of patent documents in the two most important languages of technology are now freely available for engineers, inventors and scientists the world over. This is a major contribution to strengthening the competitiveness of European businesses. The European economy as a whole will benefit, as innovating companies will now be able to better target their R&D work by searching Chinese patent documents, while further improving the substance of their patent applications. Patent offices, too,
will be able to use the service in their daily work, which will positively impact on the quality of the patenting process. This step underlines the leading role of the EPO in patent information.”
SIPO Commissioner Tian Lipu said: “Automation is one of the key areas of SIPO-EPO strategic co-operation and the launch of the Chinese-English machine translation service is another milestone of all these years’ successful co-operation. It is estimated that by the year 2013, the total volume of Chinese patent documentation will be over 10 million and since 1 July 2012, Chinese patent documentation had become the minimum PCT documentation. The machine translation service will help European IP users to conquer the Chinese language barrier in a direct and effective way. It will further promote the science and technology communications between China and Europe, and eventually serve global innovation development.
Australia’s national soil databases can now be accessed in real time online through a new iPad app called SoilMapp.
The new app provides open access to the best and most up-to-date information for soil at any location in the country within a matter of seconds.
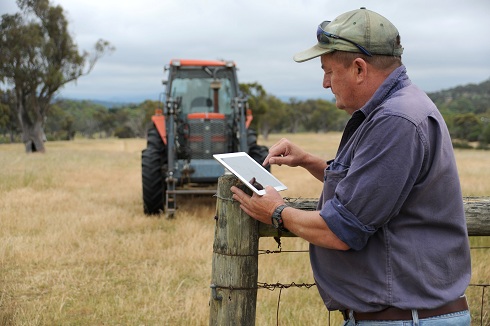
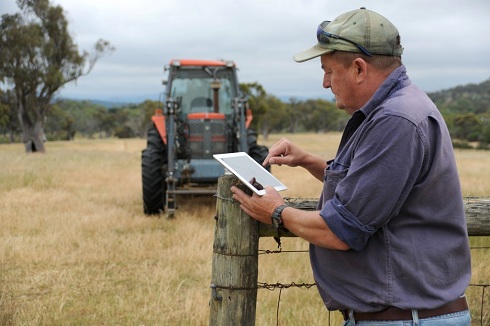
The SoilMapp for iPad will allow farmers and others to access real time information about their soils from in the field.
Information such as soil depth, acidity, salinity, soil carbon, soil water holding capacity and other attributes will help land managers, farmers and rural advisors make on-the-spot, decisions about how to more effectively manage their land.
This mobile device technology will deliver detailed scientific information on soils directly into the hands of farmers, rural consultants, agronomists, and potentially other soil enthusiasts like real estate agents, hobby farmers and keen bushwalkers.
The app has been developed by the Australian Collaborative Land Evaluation Program (ACLEP) and CSIRO, with funding from the Grains Research and Development Corporation (GRDC), because understanding soils is essential for sustaining healthy, natural environments and productive agricultural landscapes.
CSIRO’s Mike Grundy said soils are one of the most important building blocks of our agricultural and ecological systems and are a precious natural asset.
“They sustain food production, biodiversity, water quality and play a key role in human health. Understanding the characteristics of soil allows us to ensure we make decisions about its management to ensure maximum productivity and maintain or improve its health for today and future generations,” Mr Grundy said.
SoilMapp is the first app developed by CSIRO and it is being launched at the Joint Australian and New Zealand Soil Science Conference in Hobart on Tuesday, in time for World Soil Day on Wednesday. The app taps into soil information from the Australian Soil Resource Information System (ASRIS) and APSoil, the database behind the farming systems model, the Agricultural Production Systems SIMulator (APSIM), which is used worldwide.
Both these databases are stocked with contributions from thousands of individuals and organisations including the Australian Government Department of Agriculture, Fisheries and Forestry (DAFF), state and territory agencies responsible for land resource assessment, Geoscience Australia, and soil research and industry groups. The databases contain information about approximately 85,000 samples from nearly 15,000 locations, some dating back to the 1950s.
“There’s a lot of information about Australian soils stored in these two databases and the beautiful thing about SoilMapp is that it provides a user friendly mechanism for accessing that information in real time, on location,” Mr Grundy said.
“Although that information is already available through the web, it is now of far more use to famers or consultants working out on the land because it can be at your fingertips in the field, and at no cost. Importantly, as our soil agencies improve their data collections, SoilMapp will provide access to later releases,” he said.
Senior Agronomist Steve Richmond from Kerin Landmark Rural said the app will be a welcome addition to his decision making toolkit when speaking with growers.
“By understanding the soil’s characterisation, water holding capacity and amount of organic carbon, we can make calculations about how much nitrogen to use on certain crops. This could lead to improvements in fertiliser use efficiency as well helping prevent soil acidification from the overuse of nitrogen. That provides a productivity benefit as well as environmental and economic benefits,” Mr Richmond said.
“Farmers are the custodians of vast tracts of Australia, and the decisions they make daily will impact on the short and long term future of this country’s ability to feed itself, meet growing global demands and to sustain its natural beauty. The more informed we can be when making these decisions, the greater benefit we can deliver for both productivity and environmental health. It’s a win-win,” he said.
While SoilMapp for iPad currently accesses Australian information, other users may soon be able to get the benefit of this technology, with CSIRO exploring the possibility of working with partners in New Zealand, Indonesia and the Pacific Island countries to widen the scope of SoilMapp.
SoilMapp was developed by CSIRO through the Australian Collaborative Land Evaluation Program (ACLEP) and the Grains Research and Development Corporation (GRDC) project Doing it better, doing it smarter — managing soil water in Australian agriculture.
SoilMapp for iPad will be available from the App Store soon.
Media are invited to attend the Joint Australian and New Zealand Soil Science Conference on Monday and Tuesday to use SoilMapp and speak with the researchers that developed it.
Take a moment to consider Neptune. The eighth planet in our solar system, the planet farthest from the Sun, and the third most massive planet in our solar system. Also one of the least visited, and consequently one of the least understood planets in our solar system. Neptune was discovered in 1846. Forty years later, in 1886, astronomer Sir Robert Ball wrote ‘Besides this brief sketch of the discovery of Neptune, we have little to tell with regard to this distant planet. With a good telescope and a suitable magnifying power we can indeed see that Neptune has a disc, but no features on that disc can be identified’.
Unfortunately in the last 126 years not much has changed. Due to its enormous distance from Earth (~ 30 Astronomical Units) Neptune remains little more than a blurry disk in the eyepiece of the most powerful ground based telescopes. In the past astronomers studied Neptune by examining the planet as it occulted, or passed in front of the light of another object, usually a star, allowing scientists to calculate its diameter, chemical composition, and temperature. The opportunity to study the gas giant only improved when Voyager flew by Neptune in 1989, and the Hubble Space Telescope was launched in 1990.
Voyager 2 launched in 1977, and reached Neptune on the 25th of August 1989 (click here for an impressive animation of the Voyager 2 flyby of Neptune). Although Voyager 2 began imaging the planet from about 35,000,000 million miles out, most of the data we have today is from a 24 hour period, during which Voyager 2 passed 4,500 kilometres above Neptune’s north pole at an eye watering 67,000 km per hour. During the trip to Neptune Voyager gathered about 5 trillion bits of information or about .5 of a Terabyte of data. That doesn’t sound much now, but back in 1977 the 3 computers on the Voyager spacecraft had a combined memory of 68Kb, so Voyager sent back almost 15 million times more data that could be stored in it’s memory!!
Scientists were thrilled by the data from Voyager 2 and set to work learning as much as they could about the distant blue planet. We learnt that Neptune is mostly composed of gas, is likely to have a rocky or metallic core, and that the majority of Netpune’s mass is hydrogen and helium, with traces of water, methane, ammonia, and other compounds. Thanks to Voyager 2 we learnt an enormous amount about Neptune’s atmosphere, weather systems, magnetic field, moons, and ring system. But that was over 30 years ago – and we now have more questions than answers.
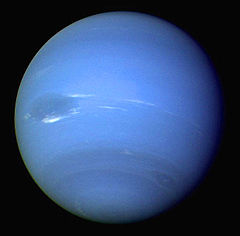
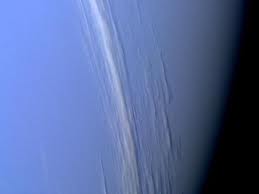
Images from Voyager 2 showed that the most obvious feature of Neptune is its stunning blue colour, the result of methane in the atmosphere. Voyager 2 also revealed a more dynamic and turbulent atmosphere than anyone expected. Neptune’s atmosphere consists of layers of clouds, banded features, and unexpected structures, including what was termed the Great Dark Spot (GDS). Neptune generates the strongest jet streams anywhere in the solar system, reaching speeds of up to 2,400 kms per hour. Voyager detected weak auroras, similar to those on Earth, but because of Neptune’s complex magnetic field, the auroras appear over wide regions of the planet, not just near the planet’s poles. Despite what we do know, the structure and composition of Neptune’s atmosphere remains poorly understood. What accounts for the relatively high percentage of methane and lack of hydrogen and helium? What is the energy source responsible for powering the incredibly high speed winds and variable storm systems? What happened to the Great Dark Spot (observed by Voyager in 1989, but no where to be seen when Hubble observed the planet in 1994). Why is the temperature of Neptune’s thermosphere, a staggeringly high 750K (4760 degrees celsius)? How can Neptune be so cold and distant from the Sun, and yet radiate so much energy?
Thanks to Voyager 2 we know that Neptune’s magnetic field is approximately 25 times stronger than Earths, and that it’s lopsided (like Uranus), at 47o to the rotation axis and offset from the planet’s centre. Although we suspect that Neptune’s magnetic field is generated by currents within Neptune’s icy mantle – we do not fully understand why Neptune’s magnetic field is oriented the way it is, or what processes could generate such an off-kilter magnetic field.
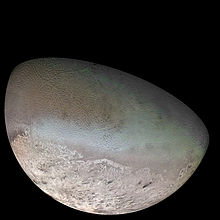
Voyager 2 image of Triton (Credit NASA)
Before Voyager 2, Neptune was thought to have 2 moons, Triton and Nereid. Voyager 2 discovered 6 new moons, and since Voyager’s visit, astronomers have discovered a further 5 moons. Most of what we know of Triton, Neptune’s largest satellite, was acquired in a single encounter by the Voyager 2 spacecraft, which imaged about 40% of its surface. If scientists were surprised by the images from Neptune, they were stunned by the images of Triton. Triton, is an icy moon with a surface temperature of -235o, the coldest place known in the solar system. Voyager’s images revealed a geologically active planet, geysers spewing nitrogen gas and dust particles high into the atmosphere, rocky outcrops, canyons, and plains of frozen methane. Triton has a very thin nitrogen atmosphere with small amounts of methane, above a scarred and cracked surface. Triton showed no fresh impact craters, an indication of an active planet experiencing periodic resurfacing. But there’s still a lot to learn. Perhaps the most tantalising questions are about Neptune’s largest moon. Was Triton formed near Neptune, or is it a captured object from the Kuiper belt? What is the composition of Triton, and what causes the geologic activity, and has the distribution of the ice geysers changed dramatically since the Voyager flyby? Will further analysis of Triton tell us more about the solar system, and our place in it? Is there a sub surface ocean? Could Triton harbour life?
Earth-based observations during the 1980s suggested that there were a number of partial rings surrounding Neptune, and Voyager 2 discovered a system of equatorial, circular rings. Although Voyager 2 gave us a good look at Neptune’s rings, the details of their composition is still uncertain, we don’t know how long they’ve been there, or even if they are stable.
Despite the valuable insights bought to us by the Voyager mission, the Hubble Space Telescope and other studies, clearly there are still a number of questions about Neptune that still need to be answered. Technology has advanced enormously since 1977 and any new mission would be well equipped to examine Neptune, its rings and a number of its moons. A mission to Neptune would enable us to learn more about our outer solar system, and exploration of Triton may provide our best opportunity to examine the surface and atmosphere of a Kuiper Belt Object in orbit around a planet in our solar system. In 2003 NASA proposed a Neptune Orbiter/Triton Explorer, however, that mission appears defunct. Neither NASA nor ESA have any current or future plans for the exploration of Neptune.
Monarch butterfly (Danaus plexippus), Source: Wikipedia Commons
Citizen Scientists
An interesting report released last week from the UK Environmental Observation Framework reveals the benefit of citizen scientists to governmental environmental organisations. The Nerc Centre for Ecology and Hydrology and the Natural History Museum in London, reviewed 234 projects – ranging from small surveys to large-scale programmes. The results found the involvement of volunteers offers “high value to research, policy and practice”.
Given the increasing number of complex scientific problems facing our communities, states and countries; coupled with the ever dwindling supply of cash on hand to fund research projects, it behooves governments to dial into this untapped source of volunteer environmental monitors and data collection specialists. People enjoy going to their local botanical gardens, taking the kids and grandkids to learn about the natural world surrounding them. A large majority of the population love their parks for taking walks and having picnics and for exercise. They want to see these lands, with the flora and fauna contained within them protected. People volunteer for things they believe in and causes they want to see sustained. That is the movement around science and the environment and why the citizen scientist movement is growing.
Scientists should be working with their governmental departments, or university outreach extension centers, to coordinate community science volunteer days. Measuring leaf litter in a forest, or tree ring growth, or monitoring a stream for the presence of certain harmful bacteria or toxic chemicals, or tallying the number of a threatened bird species are a few such projects that could be undertaken by community members. Scientists and their research teams and graduate assistants could customize their research projects with a component where they served as project managers working with the community to accomplish a piece of the data collection puzzle.
The Value – Minuses and Pluses
Of course, not every project will be appropriate for citizen scientists and a fair amount of training may have to be done, given the nature of the project. And the report touches on the fact that although the quality of the data collected by citizen scientists could be excellent, it may not be fully recognized by all researchers or policymakers. This seems to be an area that would require some policy work in setting up standards to ensure the legitimacy and recognition of such projects undertaken with contributions from citizen scientists. That minus shouldn’t be so hard to turn into a plus. Volunteer-collected data possesses a bevy of potential benefits. The use of smartphones continues to increase among consumers and with that comes development technologies in the form of apps that could play an easier role in data collection. A scientist could quite easily dispatch his volunteer army with marching orders to perform observations of the monarch butterfly (Danaus plexippus) over a 5-acre area of the park and have his/her data collection completed within a month’s time. And of course, the benefit that every bureaucrat or department chair loves to hear: it’s a cost-effective way to collect environmental data and could help meet the demands of increasing governmental reporting and compliance requirements.
Getting Started
I think it’s up to each and every one of us to identify the actions we can take that will help continue to make our environment habitable. And becoming involved in a citizen scientist program seems like an ideal way to start to make a difference in your community. Whether you are a scientist or a volunteer, the guide, produced alongside the report by the UK Environmental Observation Framework, is a great place to begin identifying and mapping out strategies for a collaborative citizen science project.
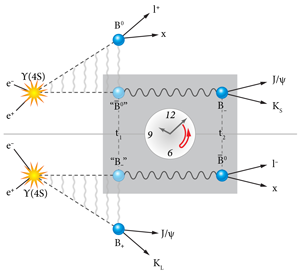
Electron-positron collisions at SLAC produce a Υ(4s) resonance that results in an entangled pair of B mesons. Source: http://physics.aps.org/articles/v5/129
Recall the outrageously cool movie from the 1980s, Back to the Future? Marty McFly and Doc Brown were stretching scientific boundaries, righting the future, all while making sure not to meet their future selves. Fast-forward and time travel may be closer than we think. (Close, relatively speaking of course.)
If you like exceptions to the rule, well, you’re in luck because the Department of Energy’s (DOE) SLAC National Accelerator Laboratory has achieved something quite impressive – the BaBar experiment.
The BaBar experiment investigates the most fundamental questions about the universe by getting back to basics with elementary particles. It’s a global collaboration of physicists delving into the nature of antimatter, the relationship of quarks and leptons and crossing over into areas of physics yet to be explored.
Earlier this week, scientists working on the BaBar project made the first direct observation of a violation to the concept known as time reversal symmetry. Their work was published in Physical Review Letters if you want to journey into the world of B mesons.
How did they do it?
Data from billions of particle collisions, nearly 10 years worth, were poured over and sifted through by researchers on this project. They examined a chain of particle transformations in which B mesons flipped between two different states called B-zero and B-even. This quantum entanglement of B mesons enables information about the first decaying particle to be used to determine the state of its partner at the time of the decay. This allowed the team to find that these transformations happened six times more often in one direction than the other.
Largely by thinking there was something wrong with the picture they were looking at was how missing pieces of the puzzle were filled in, according to the physics coordinator for BaBar, Fabio Anulli of the National Institute for Nuclear Physics in Rome. The BaBar data they had showed evidence of change-parity symmetry violation, so this was a good place to start looking. In fact, just looking at the data in a slightly different way allowed them to the see time violation.
Given the abundance of data the BaBar team had to work with, they were able to measure the T-violation to the 14 sigma level – a high level of statistical significance. Basically meaning there is only 1 chance in 1043 that this effect is not real. Recall the Higgs boson discovery this past summer; that was granted a 5 sigma level. The results demonstrate that the direction of time matters, at least for some elementary particle processes. This provides a strong confirmation that a few subatomic processes like to do things on their own schedule – they have a preferred direction of time, changing into one another much more often in one way, than they change in the other. Time does not run the same forwards as backwards.
The findings – full of futuristic possibilities
What does this mean for the future? This discovery may rock our world in ways we haven’t even conceived of yet. It could have implications for business, for communications, for me getting to Brisbane instantaneously without first stopping for a layover at LAX. We may have perhaps inched closer to that time travelling ease marvelously displayed in Star Trek. Stay tuned.
Discoveries such as this make us think about the beauty of science. The vectors and numbers and B mesons – scientists work that stuff out to provide the beautiful possibilities that are so important to the human race. It may be small now, but we’re definitely on to something bigger. Think how many picture frames we may just be able to tilt to get the answers we seek.
Minister for Innovation, Services and Small Business Louise Asher today announced that two world leaders in storm-water management and bioinformatics, Professors Ana Deletic from Monash Water for Liveability and Terence Speed from the Walter and Eliza Hall Institute, have won the 2012 Victoria Prize for Science and Innovation.
Professor Deletic is the first female scientist to be awarded the Prize in its 14 year history.
Speaking at a ceremony to award the winners of the Victoria Prize for Science and Innovation and the Victoria Fellowships, Ms Asher said the Victorian Coalition Government was committed to supporting science and innovation and had awarded two $50,000 Victoria Prizes this year instead of one, as well as increasing the number of $18,000 Victoria Fellowships from six to 12.
“The Coalition Government has invested $1.7 million in Victoria’s innovation researchers since 2011, and has committed to treble this investment over the next three years to $4.8 million,
Nearly three years ago a 10-year-old Queensland primary school student beat the rush of entries in a national competition to find a name for Australia’s new Marine National Facility research vessel.
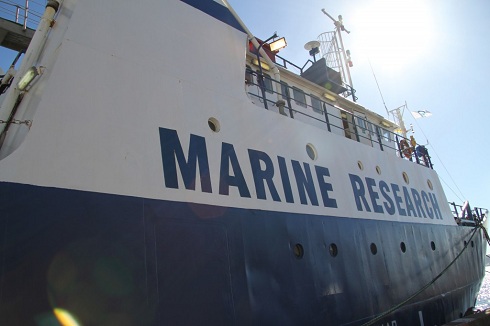
The current Marine National Facility research vessel, Southern Surveyor.
The Federal Minister for Science deemed Clare Cameron’s entry, The Flinders Investigator, the joint winner as it linked the planned A$120 million research vessel to Australia’s maritime history – Matthew Flinders first circumnavigated the continent in His Majesty’s sloop Investigator.
The new state-of-the-art 93.9 metre vessel has been named Investigator and is under construction. The vessel will herald a new era in marine and atmospheric research for Australian scientists when it arrives in late 2013.
The new Investigator provides a huge leap forward in capability, being equipped to accommodate 40 scientists and travel for up to 60 days at sea compared with the current research vessel’s, Southern Surveyor, capacity of 15 scientists and 28 days at sea.
Clare Cameron and her family, who live in Runaway Bay, have been invited to tour theSouthern Surveyor while the vessel is in Brisbane for a short port period prior to its next research voyage. Clare will meet the team of Australian and international scientists who will have returned from their research voyage in the Coral Sea.
The Chief Scientist onboard, Dr Maria Seton from the School of Geosciences at the University of Sydney, and her team have been working in a little explored region between the Solomon Islands, Vanuatu, and New Caledonia taking rock samples from the ridges and plateaus at depths of up to 3.5 km. They also have mapped about 8000 kilometres of seafloor under their voyage track and taken gravity and magnetic data.
“These data will help us to better understand the type of crust that underlies the region and the age of these basins and will give us a more complete geologic and tectonic history of the area during the last one hundred million years,” Dr Maria Seton said.
“We are trying to understand what’s going on with the Earth’s crust in this part of the world by mapping what we call hotspots, which are a series of extinct underwater volcanoes and this fundamental research helps us to determine how the Australian continent has moved.”
“We believe on this voyage we may have found remnants of the Australian continent which would have splintered from mainland Australia when eastern Gondwana starting breaking apart. It will be at least a year before our hypotheses can be confirmed.”
Dr Seton and her team will explain some of their findings to Clare and her family and show them rock samples taken from the deep seafloor, kilometres below the surface.
[Washington, D.C. and Geneva, Switzerland] — A new Internet Exchange Point (IXP) was launched on 16 November in Kinshasa, Democratic Republic of the Congo (DRC). The Kinshasa IXP (KINIX) was funded through the Internet Society’s Community Grants Programme and managed by the DRC ISP Association (ISPA-DRC), as part of its DRC-IX project, which aims to establish IXPs in Kinshasa, Lubumbashi, and Goma.
KINIX will serve as a catalyst for innovation and development of Internet services and applications in the DRC, and will support Government efforts to implement E-government services and lower the cost of developing local hosting and application development. The presence of KINIX will improve local Internet resilience by eliminating the dependence on international connectivity for local Internet services and Internet-based communications.
DRC is largely dependent on satellite connectivity for its Internet access. As the DRC waits to get connected to the West Africa Cable System, the time to access locally hosted content will be reduced significantly from over 500ms to less than 50ms through KINIX.
Initially, KINIX will connect six Internet Service Providers (ISPs): AfriNET, Cielux, Cybernet, Global Broadband Solutions, Microcom, and Vodacom. Twenty-six (26) engineers from these ISPs, including the regulator (ARPTC); Central Bank of Congo; local universities; and the tax, customs and revenue authorities among others have received technical, hands-on training prior to the launch through the Internet Society Africa Interconnection and Traffic Exchange (ITE) programme. The training sponsored by the Internet Society, and in partnership with Netnod and Jaguar Network, will also enable the network providers in the DRC to prepare their networks for interconnection with the rest of the world once the submarine cable connection is activated.
The Internet Society’s Africa Interconnection and Traffic Exchange programme has been actively supporting the development of IXPs and regional interconnection in the region. The programme aims to have 80% of Internet traffic exchanged in Africa by 2020, keeping local traffic local. This objective has been boosted by the appointment of the Internet Society to implement the African Union’s African Internet Exchange System (AXIS) programme, http://www.internetsociety.org/axis-announcement.




 The genes of long-living and virus resistant bats may provide clues to the future treatment and prevention of infectious diseases and cancer in people, the Commonwealth Scientific and Industrial Research Organization ( CSIRO), Australia’s national science agency, said in a report on Friday.



 Brussels, 6 December 2012 — Breaking new ground in providing access to the most comprehensive technological information, the European Patent Office (EPO) and the State Intellectual Property Office of the People’s Republic of China (SIPO) today launched the Chinese-English component of the EPO’s free automatic translation service Patent Translate.