Australian researchers are using a novel mobile laser 3D mapping system called Zebedee to preserve some of the country’s oldest and most culturally significant heritage sites.
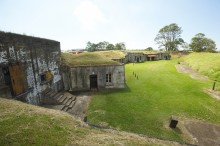
The new joint research initiative between CSIRO and The University of Queensland aims to collect detailed 3D maps of historic sites of Moreton Bay. With the assistance of Queensland Parks and Wildlife Services, the research team have collected data from a number of heritage sites including the 19th century Brisbane River defences at Fort Lytton and Peel Island’s leper colony buildings.
At the core of the technology, developed by CSIRO’s Autonomous Systems Lab in Brisbane, is a laser scanner that swings back and forth on a spring to capture millions of detailed measurements. Zebedee gives researchers the ability to reliably map an environment in 3D by simply walking through it.
“This technology is ideal for cultural heritage mapping, which is usually very time consuming and labour intensive. It can often take a whole research team a number weeks or even months to map a site with the accuracy and detail of what we can produce in a few hours,” said Dr Jonathan Roberts, Director of CSIRO’s Autonomous Systems Lab.
“Zebedee has allowed us to capture a detailed record of several key cultural heritage sites ranging from those which are fragile and risk of damage through natural disasters to those which are remote and difficult to get to,” said Professor John Macarthur, Dean and Head of the School of Architecture at The University of Queensland.
“We’re looking to use these maps in the future to create an archive of rich data about cultural heritage sites, which will allow us to analyse them without costly and time consuming hand measuring. From this, we have already analysed important aspects of Australian history. For example, the detailed map of Peel Island’s many small buildings allowed us to analyse architecture used to racially segregate people within the leper colony. The point cloud data clearly depicts how cramped and crowded the living quarters for Indigenous people were, when compared to the non-Indigenous people who lived in their own huts with scenic verandas,” he said.
The research will be officially launched by the Honourable Andrew Powell, Queensland’s Minster for Environmental Protection and Heritage during an event to mark the beginning of Australia’s National Heritage Week celebrations at Fort Lytton today.
About Zebedee
Zebedee is a handheld 3D mapping system developed by CSIRO that can scan an environment as an operator walks through it. The system produces a 3D map of the environment as well as an accurate record of the trajectory followed. The primary sensing technology utilised is LiDAR (Light Detection and Ranging), in which an infrared laser measures ranges to surfaces in the environment.
The distinguishing feature of Zebedee’s design is that the laser scanner is mounted on a spring, which provides a lightweight solution for ensuring a wide scanning field of view. The spring converts the natural motions of the operator into a suitable sweeping motion of the scanner. A low-cost inertial sensor provides rough measurements of the spring’s rotations. Specially designed software is able to convert the raw range and inertial measurements into a 3D map, represented as a pointcloud, which consists of millions of points expressed in a common coordinate frame.
About CSIRO
CSIRO is Australia’s national science agency and has been pushing the edge of what’s possible for more than 85 years. Today, the organisation has close to 6,500 people working out of 58 centres in Australia and internationally. These people work closely with industry and communities to leave a lasting legacy across five broad areas: food, health and life science industries; energy; environment; information and communications; and manufacturing, materials and minerals.
About National Heritage Week
During Australian Heritage Week, the commonwealth, state and local governments and all National Trust organisations throughout Australia, host community events to present a coordinated and cohesive approach to the importance of our heritage. For more information please visit Australian Heritage Week.
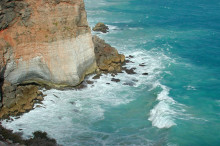
A unique Collaborative Research Science Program to improve understanding of the environmental, economic and social value of the Great Australian Bight was today announced by BP Developments Australia (BP), CSIRO and Marine Innovation Southern Australia (MISA).
The A$20 million Science Program aims to obtain information about the unique marine environment and potential marine resources within the Great Australian Bight (GAB), and will provide information to decision makers to support sustainable development in the region and monitor possible future impacts.
“The Science Program will be one of only a few whole-of-ecosystem studies undertaken in Australia,” Dr David Smith of CSIRO’s Wealth from Oceans Flagship stated. “It will focus on collating information about the marine resources of the Great Australian Bight and providing vital knowledge to inform future decisions for sustainable development in the region.”
The research officially started on 4 April 2013, with scientists setting sail for the GAB aboard the RV Southern Surveyor to collect water and seafloor sediments from depths three kilometres below the surface. These will be the deepest set of samples ever taken from the Bight and will provide an insight into the distribution, diversity and ecology of the deepwater species of animals, plants and microbes which reside in the central and eastern GAB.
“BP is already undertaking a range of studies to ensure environmentally responsible operations in the GAB. This additional multidisciplinary research program will build on these and other studies to improve the understanding of how the GAB ecosystem functions,
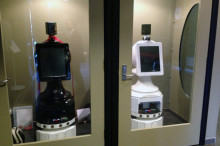
A day at the museum has come to life. Our latest robots are roaming the galleries of the National Museum of Australia. They’re using high speed broadband to allow remote visitors to control their own view of museum exhibits while interacting with a museum educator.
The stars of Museum Robot project, B1 and B2, will use telepresence technology to roam the galleries of the National Museum of Australia. Using high speed broadband, the robots will allow remote visitors to control their own view of museum exhibits while interacting with a museum educator.
“The Museum Robot is a fantastic initiative and a perfect example of some of the applications made possible by the NBN. This kind of rich and interactive experience, nationally accessible, depends on the type of synchronous communication made possible by high speed broadband,
As we move through the world, we have an innate sense of how things feel — the sensations they produce on our skin and how our bodies orient to them. Can technology leverage this? In this fun, fascinating TED-Ed lesson, learn about the field of haptics, and how it could change everything from the way we shop online to how dentists learn the telltale feel of a cavity.
Katherine Kuchenbecker works on incorporating the sense of touch directly into virtual objects. Imagine being able to feel textures on your digital screens.
Is it possible to incorporate the sense of touch into the digital world?
An initiative that will help Australia harness cutting-edge advances in biological sciences to inform better environmental management decision making will be announced on Wednesday 3 April at the official launch of the Centre for Biodiversity Analysis, Canberra.
The Centre is a joint initiative established in partnership with CSIRO and the Australian National University (ANU).
“The Centre is drawing on CSIRO and ANU’s world class expertise, and harnessing new and emerging technologies in biodiversity science to improve our knowledge of Australia’s biodiversity and enable governments and conservation NGOs to translate policy into meaningful actions,” said Professor Craig Moritz, Director of the Centre for Biodiversity Analysis.
“The Centre is drawing on CSIRO and ANU’s world class expertise, and harnessing new and emerging technologies in biodiversity science to improve our knowledge of Australia’s biodiversity and enable governments and conservation NGOs to translate policy into meaningful actions.”
Professor Craig Moritz, Director, Centre for Biodiversity Analysis
“It’s estimated that Australia is home to over half a million unique living species, many of which are found nowhere else on Earth, but of these only about one third are known to science.”
“Improved knowledge of Australia’s biodiversity – how many species, where they are, and how they evolve across environments and through time – will be especially important to ensure sustainable development and production, to maximize ecosystem benefits, and to protect our unique diversity in the face of rapid environmental change,” he said.
CSIRO and ANU have joined forces to address this challenge.
“The Centre will promote collaborative biodiversity science by hosting conferences and workshops, forming ANU-CSIRO working groups, supporting collaborative projects, connecting students and researchers with managers and policy makers, and facilitating the collation and connection of biodiversity information in the ANU-CSIRO Canberra Precinct,” said Professor Moritz.
The Centre also provides an early example of the value of the developing Canberra Global Research Precinct, which will focus on plant and environmental sciences. Like the Centre, the Precinct will be built on CSIRO-ANU collaboration, and will utilise its location in the national capital to promote the uptake of research outputs by government agencies.
The launch will also mark the opening of the Centre’s inaugural conference which brings together Australian and international biodiversity scientists to discuss recent advances in biodiversity genomics.
“Genomics is an exciting and rapidly expanding field that has the potential to significantly improve the efficiency of environmental assessments and monitoring, and the speed at which new species can be identified,” said Professor Moritz.
“It is also providing important new insights into the ability of species to adapt to climate change.”
Media are invited to attend the launch and associated conference.
Location: CSIRO Discovery Centre, Clunies Ross St, Black Mountain, ACT
How genome sequencing technologies are helping in the fight against Tasmanian devil facial tumour disease.
Devil facial tumor disease (DFTD) is threatening the iconic Tasmanian devil with extinction in the wild within the next few decades. Genome sequencing has highlighted the low levels of genetic diversity within the population and the importance of selecting individuals for the careful maintenance of genetic diversity within conservation insurance colonies. Genomic technologies are allowing rapid progress to be made in our understanding of the disease.
Combining genomics and evolutionary theory to understand how species respond to climate change. There has been much recent debate about the potential for evolutionary changes to enable species to adapt to the stressful effects of climate change. We will discuss the current body of evidence supporting this, how genomic techniques can provide valuable insights into evolutionary adaptation, how evolutionary approaches can be used to predict future changes in biodiversity, and what the implications are for conservation strategies.
Mining genomic data from museum collections to understand how species change over time. Biological collections-based research is poised at another exciting transition because of research avenues made possible by the tools of genomics. Traditional museum collections are large repositories of dormant genetic data. This treasure trove of taxonomic, spatial and temporal data is now within reach thanks to genomic technologies. The insights gained are providing valuable contributions to our knowledge and, in-turn, the preservation of Australia’s biodiversity.
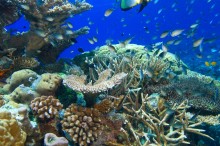
Image: Research undertaken by the Centre for Biodiversity Analysis will help to inform the sustainable management of Australia’s unique ecosystems, such as the Great Barrier Reef. (Image: Marie Davies)
The first ‘World Research and Innovation Congress – Pioneers in Healthcare’ conference takes place at Steigenberger Grandhotel, Brussels on the 5 and 6 June, 2013.
The two day event will bring together over 500 of the world’s top scientific health professionals to discuss future challenges and strategies on the key issues facing health research today.
Speakers include:
Professor Anne Glover, Chief Scientific Advisor to the President of the European Commission
Scientists from CSIRO and the University of Western Australia have teamed up with Kimberley Traditional Owners to test a new molecular technique that has the potential to revolutionise the discovery of new species, particularly those living in remote and poorly studied parts of the world.
Working in the virtually inaccessible rainforest vine thickets of Australia’s National Heritage-listed Kimberley region, the team are using a technique known as ‘ecogenomics’ to survey the area’s insect biodiversity, and rapidly describe what are expected to be hundreds of unique and rare species. The technique involves identifying species based on their DNA and morphology, and is much faster and more cost effective than traditional taxonomic approaches.
“Using ecogenomics, we will be able to understand what is there and how unique it is in months rather than decades,” said CSIRO’s Dr Owain Edwards, the project leader.
“Identifying, or describing, new species is the first step towards ensuring their ongoing survival. However, with millions of undescribed species around the world, this is no small task, particularly as many of these species will likely be found in remote locations.”
“Faster ways of surveying biodiversity are essential if we are going to effectively manage the world’s unique ecosystems.”
The remote and hard to access nature of the rainforest pockets of northwest Kimberley, as well as their isolation from each other, mean that the insect life there is some of the least known on the planet and is likely to be highly endemic (which means unique to that area). This provided the ideal location for the team to put ecogenomics to the test.
“Over the coming months we’ll be analysing the DNA of about 300 000 insect specimens collected from 36 isolated rainforest pockets across the Kimberley and screening them for the presence of endemic species,” said Professor Raphael Didham, an invertebrate expert that holds a joint position with CSIRO and the University of Western Australia.
“We’re hoping to find hundreds of new species. It’s pretty exciting work.”
The technique also has the potential to improve the efficiency of environmental impact assessments and conservation management.
“The speed and accuracy at which we’ll be able to assess a given site, even a really remote one, will greatly improve the efficiency of evaluating possible biodiversity impacts,” said Dr Edwards.
The scientists and Indigenous rangers from the Wunambal Gaambera and Dambimangari Aboriginal Corporations carried out the wet-season insect surveys over a one month period in January, at a time when the Kimberley is in its active growing season.
The team clocked up over 7000 kilometres in a helicopter accessing the isolated rainforest pockets across a 21 000 square kilometre region of the northwest Kimberley.
On-the-ground training provided to rangers as part of the project will mean insect sampling activities can continue in the Kimberley in the future.
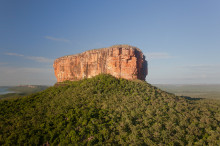
Source, and image: Approaching Mt Trafalgar, northwest Kimberley. The team surveyed the rainforest patch visible (dark green) in the lower left corner of the photo: http://www.csiro.au/en/Portals/Media/DNA-technology-set-to-speed-up-species-discovery.aspx
Ever gazed out over the sea and wondered what creatures great and small lie beneath? Wouldn’t it be great if the water was so transparent you could see all that swam by?
The Australian fish world was abuzz this week with the release of FishMap, an online mapping tool that allows humans to check out where their favourite marine fish are living these days. You can see what fish are living in your area and what depth they tend to hang out at, just in case you wanted to drop by. The tool gives fish around Australia an unprecedented ability to compete for the attentions of people. With 4500 Australian marine fishes listed, including our 320 sharks and rays, there are sure to be plenty jostling for your affection.
With FishMap you can find out what fish occur at any location or depth in the waters of Australia’s continental shelf and slope. You can also create species lists for any region that include photographs and illustrations, distribution maps and current scientific and common names.
According to the Australian Bureau of Statistics more than five million Australians take part in recreational fishing in Australia as a leisure activity.
There is also a large commercial seafood and aquaculture industry which is worth over $2 billion annually and employs around 16,000 people.
Combined with the number of people who love a good feed of fish, there are a lot of people with a direct interest in the oceans and seas of Australia and what is in them.
Just in time to celebrate Open Education Week, here comes a new initiative, the School of Open, a learning environment focused on increasing our understanding of “openness
Measuring the impact of Australian migration on the Australian carbon footprint is a difficult task because of the complexity of the factors involved. However, a direct cause and effect relationship between the two exists, and it is related partially to population growth due to overseas migration, as well as to rural-urban migrations. Both of which are the consequence of the modernisation and urbanisation of Australian society. This article will present data and research findings about some of the factors that need to be taken into account when discussing the issue of the Australian greenhouse gas emissions. In conclusion it will also share some insights into some of the ways in which the Australian carbon footprint can be reduced.
Rural-Urban Migration
Australia is increasingly becoming an urbanised nation and the scope of migrations from rural to urban areas has recently been growing. A typically higher standard of living in urban areas, industrial development, the built environment and technological advancement; all have a considerable impact on the environment. With urbanisation, the consumption pattern in Australia is changing, and there is a significant increase in consumption per capita.
Recently, there has been more research on how population growth and internal migration into urban areas affect the environment. Australian households are directly responsible for about 20 percent of total carbon pollution. The increasing production of consumer goods has a major impact on the environment – there is an increase of carbon dioxide emissions, or greenhouse gas (GHG) emissions, which is considered the main cause of global warming. Consumption per capita is greater in urban than in rural areas. Greater volumes of transport and removals also have their share in the increase of the carbon footprint. The increase in waste streams resulting from greater consumption causes an amplification of emissions from landfill facilities, which currently emit about 15 million tonnes of carbon pollution per year.[1]
One of the ways to analyse household greenhouse gas expenditure is to break down how much energy consumption and greenhouse gas emissions a human being requires for different needs and aspects of living (such as food or mobility). According to Dr Manfred Lenzen, Professor of Sustainability Research at Integrated Sustainability Analysis (ISA) at the University of Sydney, the analysis of energy and greenhouse gas requirements of different stages in the economy is a better way to structure the data which needs to be considered when creating policies related to the reduction of the carbon footprint.[2]
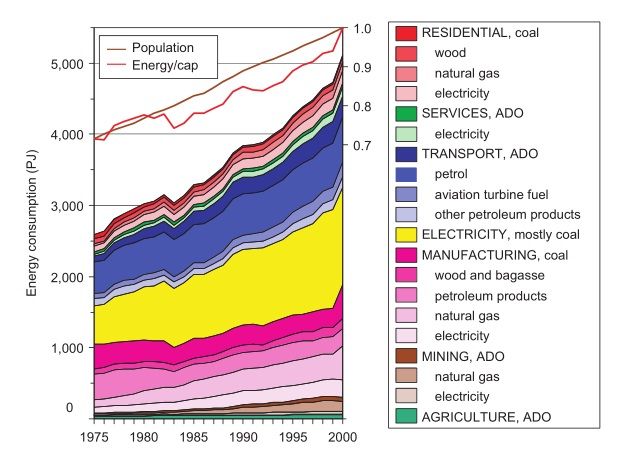
Energy consumption in Australia 1975–2000 (Australian Bureau of Agricultural and Resource Economics 2006)*
Professor Lenzen explained to us that the main advantage of the input-output method is that it includes a complete picture of a household’s GHG responsibility. In some information material from Professor Lenzen’s studies we see that the focus is on switching lights off, having shorter showers, or driving less. But what about our shopping habits? How much emissions were caused because of that T-shirt I just bought, or that flat-screen TV, or that surfboard, or that movie ticket, or that insurance policy? Such things are actually two thirds of the story and must not be ignored. Because if they were, policy would not be as effective as it could be. When it comes to the difference between the consumption-related carbon emissions of households in urban and in rural areas, people in the inner city drive less, so they have some advantages there. However people in rural households usually earn, and therefore spend less, which ultimately is a stronger effect, and therefore rural households cause (generally speaking) less GHG emissions.[3]
The increased need for residential space is another large contributor to carbon pollution through the construction industry and the disposal of demolition waste. Investments into energy efficient homes and appliances provide a partial solution to this problem. According to Professor Dr Deo Prasad, Director of the UNSW Centre for a Sustainable Built Environment, most of the potential low cost greenhouse gas emissions saving opportunities are known to be in the built environment – anywhere between 40-70%, depending on which report and boundary conditions they relate to. However, past experience suggests that market failure/barriers will prevent uptake of these opportunities, even with a price on carbon. In December last year Professor Prasad was one of the experts who launched the Low Carbon Living CRC, which brings together key property, planning, engineering and policy organisations with leading Australian researchers. Their focus was to develop new social, technological and policy tools for reducing greenhouse gas emissions in the built environment. The CRC will help unlock barriers to cost-effective carbon reduction opportunities, empower communities and facilitate the widespread adoption of integrated renewable energy. This will enable the sector to transition and contribute to Australia’s greenhouse gas emissions targets while maintaining industry competitiveness and improving quality of life.[4]
If we look at overall CO2 emissions of countries, according to the 2012 report on trends in global CO2 emissions by the PBL Netherlands Environmental Assessment Agency, Australia is the 16th biggest polluter in the world. However, if we look at CO2 emissions per capita, Australia has earned the unflattering title of the biggest polluter on the planet in 2009, when it replaced the U.S. in the first position with 18.3 tonnes of CO2 emissions per capita. In 2011, while the U.S. CO2 emission levels per capita decreased by 2 percent; Australia’s emissions rose by 3 percent.
Dr David Stern, Professor at the Australian National University and research associate at the Centre for Climate Economics and Policy, discusses his research findings; taking into account the differences between Australia and other countries in terms of the climate, and the type of industries we have – for example, we need less heating but the mining industry is very energy intensive – and other factors, Australia is relatively energy inefficient compared to other developed countries and progress on improving energy efficiency has been quite slow.[5]
There is probably a lot of scope for improving energy efficiency on the consumer side of the economy – energy efficiency of houses, water heating etc. The rebound effect where savings in energy costs are used to spend on other energy using goods and services is more limited for consumers than for industry, and so the gains could be substantial without a lot of take back. Of course, reduced energy use reduces carbon emissions. The Australian government’s carbon price will probably have some effect on this but better information, building codes etc. can help. We have the Energy Efficiency Rating (EER) system for houses for example, but do people know what it means?[6]
Professor Stern also points out that the biggest impact of immigration is going to be that immigrants are generally coming from countries with lower carbon emissions per capita than Australia. The fraction of immigrants coming from the US, Canada, Qatar etc. is small, though there are some. So, when immigrants move to Australia they will increase their emissions on average and that will increase global emissions.
Even though population growth is often quoted as one of the main reasons for the increase in Australia’s CO2 emissions, Australian society and economy are continually evolving and new technologies which contribute to sustainability are being developed on a constant basis. Therefore it is difficult if not impossible to calculate the optimal urban population growth of Australia. Greater sustainability can be achieved mainly through the regulation of urban development and consumption patterns in urban areas – these are the two factors that the government can easily influence both through direct and indirect measures. Urban planning additionally decreases the average commuting time, which is also a significant polluting factor.
Overseas Migration
More than one-fifth, i.e. 23 percent of Australians were born overseas. The majority of immigrants choose to settle in major cities – according to the 2006 Census, 82 percent of overseas-born Australian residents live in major urban areas. In comparison, only 61 percent of Australia-born citizens live in urban areas.[7] Since most migrants move into urban areas, they tend to adopt average urban Australian consumption patterns.
Net overseas migration (NOM) is the difference between the number of people leaving Australia and arriving to Australia in the long term. The influence of NOM on greenhouse gas emissions has been researched, and here are some projections of how NOM will influence air pollution in Australia in the future based on research conducted by the Australian Government Department of Immigration and Citizenship summarized in “Long-term physical implications of net overseas migration: Australia in 2050
All of the previous research has relied on self-reported measures of Facebook use (that is, survey questions). We know from research in other areas of human behavior that there are significant differences between actual and self reported behaviors. One of my favorite examples is a study where researchers found that up to 50% of self-reported non-smoking head and neck cancer patients were indeed smoking as measured by exhaled carbon monoxide levels and levels of a nicotine metabolite in their blood.
As you might imagine, differences between self-reported and actual uses of Facebook could drastically change or even negate findings of how Facebook use is related to the aforementioned outcomes. My latest paper published in Computers in Human Behavior, Comparing actual and self-reported measures of Facebook useexamines these differences.
Here is what I did: I paid students to allow me to install a monitor on their computers for one month. I also surveyed them to ask them how much time they spent on Facebook and how many times they logged in to the site. I also monitored/asked about other forms of tech/social media use (like Twitter and email).
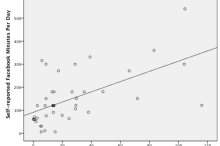
Here is what I found: As you can see in the scatterplot below, there was a significant positive correlation between self-reported and actual Facebook use (Pearson’s r = .587, p < .001).
However, and here is the really interesting part, students significantly overestimated the amount of time they spent on Facebook. They reported spending an average of 149 minutes per day on Facebook which was significantly higher than the 26 minutes per day they actually spent on the site (t(41) = 8.068, p < .001).
What is going on? In the paper, I go into much more detail about why there is such a large and significant difference between actual and self-reported Facebook use, as well as why the two are significantly correlated. In brief:
It could be that self-report questions aren’t specific enough to capture frequency of Facebook usage. Students may interpret a question asking “how much time do you spend on Facebook each day?
Established in 2009 with funding support of A$2.3 million from the Government of Western Australia, WAGCOE brought researchers, industry, investors and government agencies together with the shared vision of creating zero-emission geothermal cities.
Representatives from the partner organisations of The University of Western Australia, CSIRO and Curtin University, as well as state government agencies and industry groups gathered at the Australian Resources Research Centre (ARRC) in south Perth today to reflect on WAGCOE’s achievements, and consider the future of geothermal energy in Australia.
WAGCOE Director Professor Klaus Regenauer-Lieb said the centre had strived to underpin a new era of energy development by developing local solutions.
“At WAGCOE we provided a world-class research and training environment where scientists developed local solutions to revolutionise energy development in Western Australia and contribute to the goal of powering zero-emission geothermal cities.”
Professor Klaus Regenauer-Lieb, WAGCOE Director
“When we consider the challenges of climate change and the need to develop reliable sources of renewable energy, the work of WAGCOE is less about the last four years, than the next 50 years,” Professor Regenauer-Lieb said.
“At WAGCOE we provided a world-class research and training environment where scientists developed local solutions to revolutionise energy development in Western Australia and contribute to the goal of powering zero-emission geothermal cities.”
Internationally, the work of WAGCOE led to the Geothermal Energy Association (GEA) identifying Perth as one of the top ten (number five) “Geothermal Cities” of the world. Unlike other entries to the list, however, Perth’s inclusion was unique as it was earned on the merit of plans to become the world’s first geothermally-cooled city.
Among WAGCOE’s other major achievements was the development of a 3-D computer model illustrating a comprehensive geological assessment of the entire Perth Basin, which will act as a template for future geothermal activities in the region.
The centre was also instrumental in securing A$20 million of Australian Government funding for the CSIRO Geothermal Project, which will aim to prove the viability of using geothermal energy on a large-scale by cooling the Pawsey Centre Supercomputer located at the ARRC facility in south Perth.
A successful CSIRO Geothermal project will provide enormous benefits to the geothermal industry, and make significant progress in establishing Perth as the world’s first geothermally-cooled city.
For further information about geothermal research and activities post-WAGCOE, please contact Professor Klaus Regenauer-Lieb on +61 8 6436 8693, or Klaus.Regenauer-Lieb@csiro.au
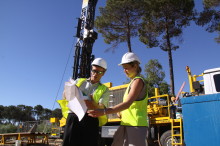
Source and image: WAGCOE Director Professor Klaus Regenauer-Lieb discusses the CSIRO Geothermal Project with project officer Jacqui Cook, at the ARRC site in Perth.