Just in time to celebrate Open Education Week, here comes a new initiative, the School of Open, a learning environment focused on increasing our understanding of “openness
Blog
-

Weekly Science Picks
Ahhh, the end of the week again. It seems that every time it’s my turn to give the weekly science picks, it’s been an interesting week in science. This leads me to believe that every week is an interesting week in science! Amongst other things, this week was the birthday of Albert Einstein – March the 14th. Which, to those who use American date formats, might also be known as Pi Day. But enough irrational trivia. Here are the things which caught my eye this week…
Probably the biggest news this week was the fact that those lovely people at CERN have officially confirmed that the particle which they announced last summer is indeed the much acclaimed Higgs boson!
Physicists Say They Have Found a Higgs Boson
“To me it is clear that we are dealing with a Higgs boson, though we still have a long way to go to know what kind of Higgs boson it is,” said Joe Incandela, a physicist who heads one of the two main teams at CERN, each involving about 3,000 scientists.
Meanwhile, Colossal shows some rather impressive trickery with water, sine waves, and a video camera set to the right frame rate. I can’t really do justice to this one with words. Just… have a look.
This is What Happens When You Run Water Through a 24Hz Sine Wave
What!? How is this even possible? Because science, my friends. Brusspup’s latest video explores what happens when a stream of water is exposed to an audio speaker producing a loud 24hz sine wave. If I understand correctly the camera frame rate has been adjusted to the match the vibration of the air (so, 24fps) thus creating … magic zigzagging water. Or something.

On a more serious note, good news in the medical world! A device has been created which can enable human livers available for transplant to survive outside the body for a whole day – something utterly without precedent. Something like this is most certainly going to save lives!
Donor livers kept alive outside the body for 24 hours
Donated livers can survive for at least a day outside the body thanks to a new device which keeps the organ ticking over as if it hadn’t been removed. The machine is likely to more than double the availability of livers for transplant.
A lot further from home, this week saw a science meeting to celebrate the 20th anniversary of the Keck observatory on Mauna Kea, Hawaii. Among all the lovely new science presented at the meeting, UC Berkeley’s Geoff Marcy announced new findings which suggest than a whopping 23% of Sun-like stars have at least one Earth-sized planet in orbit around them. Pretty amazing…
Quarter of Sun-Like Stars Host Earth-Size Worlds
“I’ll say that again, because that number really surprised me: 23 percent of sun-like stars have a nearly-Earth-sized planet orbiting in tight orbits within 0.25 AU of the host stars,
-

The Carbon Footprint of Australian Migrations
Measuring the impact of Australian migration on the Australian carbon footprint is a difficult task because of the complexity of the factors involved. However, a direct cause and effect relationship between the two exists, and it is related partially to population growth due to overseas migration, as well as to rural-urban migrations. Both of which are the consequence of the modernisation and urbanisation of Australian society. This article will present data and research findings about some of the factors that need to be taken into account when discussing the issue of the Australian greenhouse gas emissions. In conclusion it will also share some insights into some of the ways in which the Australian carbon footprint can be reduced.
Rural-Urban Migration
Australia is increasingly becoming an urbanised nation and the scope of migrations from rural to urban areas has recently been growing. A typically higher standard of living in urban areas, industrial development, the built environment and technological advancement; all have a considerable impact on the environment. With urbanisation, the consumption pattern in Australia is changing, and there is a significant increase in consumption per capita.
Recently, there has been more research on how population growth and internal migration into urban areas affect the environment. Australian households are directly responsible for about 20 percent of total carbon pollution. The increasing production of consumer goods has a major impact on the environment – there is an increase of carbon dioxide emissions, or greenhouse gas (GHG) emissions, which is considered the main cause of global warming. Consumption per capita is greater in urban than in rural areas. Greater volumes of transport and removals also have their share in the increase of the carbon footprint. The increase in waste streams resulting from greater consumption causes an amplification of emissions from landfill facilities, which currently emit about 15 million tonnes of carbon pollution per year.[1]
One of the ways to analyse household greenhouse gas expenditure is to break down how much energy consumption and greenhouse gas emissions a human being requires for different needs and aspects of living (such as food or mobility). According to Dr Manfred Lenzen, Professor of Sustainability Research at Integrated Sustainability Analysis (ISA) at the University of Sydney, the analysis of energy and greenhouse gas requirements of different stages in the economy is a better way to structure the data which needs to be considered when creating policies related to the reduction of the carbon footprint.[2]
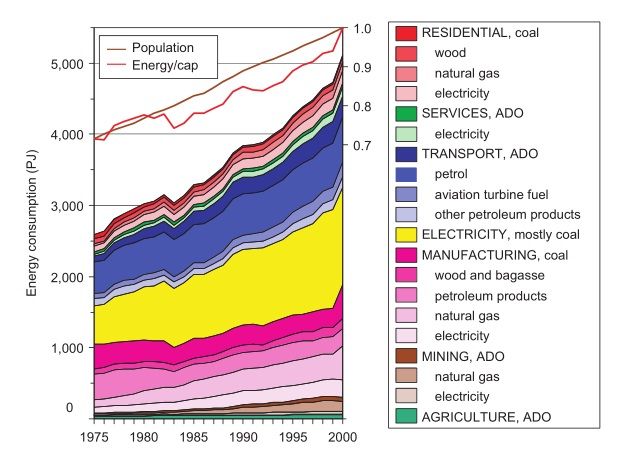
Energy consumption in Australia 1975–2000 (Australian Bureau of Agricultural and
Resource Economics 2006)*Professor Lenzen explained to us that the main advantage of the input-output method is that it includes a complete picture of a household’s GHG responsibility. In some information material from Professor Lenzen’s studies we see that the focus is on switching lights off, having shorter showers, or driving less. But what about our shopping habits? How much emissions were caused because of that T-shirt I just bought, or that flat-screen TV, or that surfboard, or that movie ticket, or that insurance policy? Such things are actually two thirds of the story and must not be ignored. Because if they were, policy would not be as effective as it could be. When it comes to the difference between the consumption-related carbon emissions of households in urban and in rural areas, people in the inner city drive less, so they have some advantages there. However people in rural households usually earn, and therefore spend less, which ultimately is a stronger effect, and therefore rural households cause (generally speaking) less GHG emissions.[3]
The increased need for residential space is another large contributor to carbon pollution through the construction industry and the disposal of demolition waste. Investments into energy efficient homes and appliances provide a partial solution to this problem. According to Professor Dr Deo Prasad, Director of the UNSW Centre for a Sustainable Built Environment, most of the potential low cost greenhouse gas emissions saving opportunities are known to be in the built environment – anywhere between 40-70%, depending on which report and boundary conditions they relate to. However, past experience suggests that market failure/barriers will prevent uptake of these opportunities, even with a price on carbon. In December last year Professor Prasad was one of the experts who launched the Low Carbon Living CRC, which brings together key property, planning, engineering and policy organisations with leading Australian researchers. Their focus was to develop new social, technological and policy tools for reducing greenhouse gas emissions in the built environment. The CRC will help unlock barriers to cost-effective carbon reduction opportunities, empower communities and facilitate the widespread adoption of integrated renewable energy. This will enable the sector to transition and contribute to Australia’s greenhouse gas emissions targets while maintaining industry competitiveness and improving quality of life.[4]
If we look at overall CO2 emissions of countries, according to the 2012 report on trends in global CO2 emissions by the PBL Netherlands Environmental Assessment Agency, Australia is the 16th biggest polluter in the world. However, if we look at CO2 emissions per capita, Australia has earned the unflattering title of the biggest polluter on the planet in 2009, when it replaced the U.S. in the first position with 18.3 tonnes of CO2 emissions per capita. In 2011, while the U.S. CO2 emission levels per capita decreased by 2 percent; Australia’s emissions rose by 3 percent.
Dr David Stern, Professor at the Australian National University and research associate at the Centre for Climate Economics and Policy, discusses his research findings; taking into account the differences between Australia and other countries in terms of the climate, and the type of industries we have – for example, we need less heating but the mining industry is very energy intensive – and other factors, Australia is relatively energy inefficient compared to other developed countries and progress on improving energy efficiency has been quite slow.[5]
There is probably a lot of scope for improving energy efficiency on the consumer side of the economy – energy efficiency of houses, water heating etc. The rebound effect where savings in energy costs are used to spend on other energy using goods and services is more limited for consumers than for industry, and so the gains could be substantial without a lot of take back. Of course, reduced energy use reduces carbon emissions. The Australian government’s carbon price will probably have some effect on this but better information, building codes etc. can help. We have the Energy Efficiency Rating (EER) system for houses for example, but do people know what it means?[6]
Professor Stern also points out that the biggest impact of immigration is going to be that immigrants are generally coming from countries with lower carbon emissions per capita than Australia. The fraction of immigrants coming from the US, Canada, Qatar etc. is small, though there are some. So, when immigrants move to Australia they will increase their emissions on average and that will increase global emissions.
Even though population growth is often quoted as one of the main reasons for the increase in Australia’s CO2 emissions, Australian society and economy are continually evolving and new technologies which contribute to sustainability are being developed on a constant basis. Therefore it is difficult if not impossible to calculate the optimal urban population growth of Australia. Greater sustainability can be achieved mainly through the regulation of urban development and consumption patterns in urban areas – these are the two factors that the government can easily influence both through direct and indirect measures. Urban planning additionally decreases the average commuting time, which is also a significant polluting factor.
Overseas Migration
More than one-fifth, i.e. 23 percent of Australians were born overseas. The majority of immigrants choose to settle in major cities – according to the 2006 Census, 82 percent of overseas-born Australian residents live in major urban areas. In comparison, only 61 percent of Australia-born citizens live in urban areas.[7] Since most migrants move into urban areas, they tend to adopt average urban Australian consumption patterns.
Net overseas migration (NOM) is the difference between the number of people leaving Australia and arriving to Australia in the long term. The influence of NOM on greenhouse gas emissions has been researched, and here are some projections of how NOM will influence air pollution in Australia in the future based on research conducted by the Australian Government Department of Immigration and Citizenship summarized in “Long-term physical implications of net overseas migration: Australia in 2050
-

Combating the rise of the superbugs: The health and scientific challenges of antibiotic resistance
It’s hard to imagine the world prior to antibiotics, a world where even a deep laceration could frequently spell significant illness or even death due to infection. Thankfully, since the discovery of penicillin in 1929 by Alexander Fleming, we now have a range of potent antibiotics to treat many of the various types of bacterial infection.
There is a problem though, bacteria are great survivors and have been competing against other bacteria and microorganisms for billions of years. As Professor Matt Cooper from the University of Queensland puts it “Billions of years ago, bacterial species were engaged in an arms race against each other and the chemicals they developed to kill one another have been modified into today’s antibiotics”.1
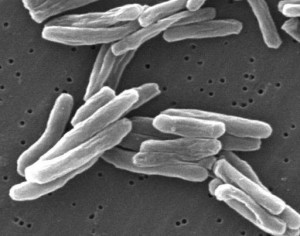
Multi-Drug resistant Tuberculosis is a particular concern for health authorities and clinicians due to limited treatment options. Unfortunately it’s our overuse of these important drugs which has driven the rapid development of antibiotic resistance, the process whereby bacteria containing mutations in their DNA, that provide some protection from an antibiotic, have an enormous survival advantage when exposed to the antibiotic and pretty soon dominate. Frequent exposures to the antibiotic may further strengthen these survival traits via the selection process, rendering the the drug less effective over time. It’s a great example of random variations leading to non-random adaptions through natural selection, although one with profound consequences for human health.
Of particular concern are bacteria that have developed resistance to multiple types of antibiotics, resulting in particularly dangerous resistant bacteria such as the multi-drug resistant variants of tuberculosis, that are extremely difficult to treat. Indeed leading health authorities are so worried about the problem that the Chief Medical Officer of the UK, Professor Dame Sally Davies, has recently labelled the threat as “catastrophic
-

Work, Play & Learn! Using libraries for Social Learning, Impact and Collaboration
The digital information and knowledge paradigm in the 21st century requires skills such as digital literacy, critical thinking, problem solving, skills in communication, and collaboration for overcoming present social and digital inequalities. Those skills go beyond pure technological affordances and they could easily be obtained through collaborative learning practices and social interaction between individuals from different backgrounds and areas of expertise.
Libraries, as environments for social learning and collaboration, present facilitators of education and knowledge. With accelerating dissemination of information in a digital age, libraries emphasise their activities on providing an information commons. In other words, an informal interactive learning place that encourages its visitors to communicate, contribute, participate, and engage with the library. This new dynamic leads towards a collaborative, social construction, and sharing of information and knowledge.
One of the researchers at the Urban Informatics Research Lab at Queensland University of Technology (QUT), interaction designer and interactive technology developer Mark Bilandzic, explores how informal learning environments can support the social side of learning, as well as how smart space technology can be designed to enhance social learning among users? As a part of Bilandzic’s research, he designed a system with the purpose of enhancing awareness of opportunities for social learning and collaboration – called “Gelatine
-

Svetlana Savitskaya – Test Pilot and Cosmonaut!
This article is the second in a series of articles in which I will profile every woman astronaut, cosmonaut and taikonaut who has been into space. Last time we looked at the career of Valentina Tereshkova, the first woman in space. Today I’m profiling cosmonaut Svetlana Savitskaya, the second woman in space. (The feature image above is a collection of drawings of women astronauts by artist Phillip J Bond. You can find Phillip’s wonderful series on women astronauts here.)
Svetlana Savitskaya is a record breaking Russian aviator and cosmonaut.
Born in Moscow in 1948, Svetlana was raised in a middle class family. In high school she was a keen parachutist, and in 1970 she won 6th place in FAI (Fédération Aéronautique Internationale) World Aerobic Championship, went on to set 18 international world records in MiG aircraft, and set 3 international records in team parachute jumping. In 1974, Svetlana began a career as a pilot after urging from her father, a Deputy Commander of the Soviet Air Defences and World War II air hero. Her father had recognised her interest in flying and parachuting and was very keen for Svetlana to pursue pilot school. Just two years after finishing pilot school Svetlana went on to become a test pilot.
In the late 1970’s the Soviet Union realised that the US was planning to send women into space within a few years. Svetlana noted that at the time, that although the Russians had the first woman in space (Valentina Tereshkova) they wanted to keep their record intact and beat the Americans once again. So they advertised and recruited a number of women candidates for cosmonaut school. In July 1980, 32 year old Svetlana was chosen for cosmonaut training. She successfully completed the arduous training programs for both the Salyut 7 (Russian Space Station) and Soyuz space craft.
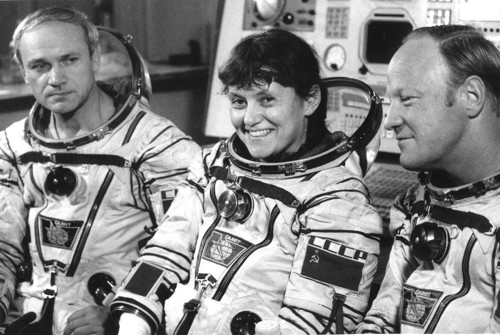
Svetlana Savitskaya After training, Svetlana was selected as a member of the 3 person crew for the Soyuz T-7 mission. This mission was to fly to the Salyut 7 space station, stay for approximately 7 days to conduct experiments and then return to Earth aboard the Soyuz T-5. The launch of Soyuz T-7 from the Baikonur Cosmodrome at 23:12 hours on 19 August 1982 was flawless. Svetlana, along with Leonid Popov and Alexander Serebrov flew aboard the Soyuz T-7 to dock with the Salyut 7 space station.
After docking with the Salyut 7 space station, Svetlana boarded the vessel only to be greeted by a fellow cosmonaut Valentin Lebedev, who subsequently gave her an apron and told her to ‘start work’. Despite what many cosmonauts thought, Svetlana was there to conduct experiments and throughout the mission she conducted experiments on the cardiovascular system, motion sickness, eye movement as well as an electrophoresis experiment on human cells. After 7 days, 21 hours and 52 minutes Svetlana and her crew returned to earth landing safely just 112 km northeast of Arkalyk. This trip resulted in Svetlana becoming only the 2nd woman in space at that time, and it was also the first human spaceflight by mixed female and male crew. Svetlana’s flight made her a national hero.

Svetlana Savitskaya (Credit Ria Novosti) On the 17th of July 1984, on the 50th Soyuz spaceflight, Svetlana Savitskaya became the first woman to fly a second space mission when Soyuz T12 launched a mission to conduct maintenance operations on Salyut 7. During the mission Svetlana conducted various experiments and completed repairs to the space station. On 25 July 1984 Svetlana and Dzhanibekov donned their space suits and exited Salyut 7 to perform maintenance on the outside of the space craft. Their tasks involved cutting, welding and soldering tests on the outside of Salyut 7. Their space walk (or Extra Vehicular Activity) lasted 3 hours and 55 minutes. Svetlana had broken one more record, the first woman to conduct a space walk.
The mission ended a few days later after 11 days, 19 hours, 14 minutes and 36 seconds in space. After her last flight Svetlana remained an active cosmonaut and was appointed as Deputy to the Chief Designer of the Energia Project in 1987. Although Svetlana never made another space flight, she remains a symbol of her nation’s pride and achievements. Svetlana retired as a Major from the Russian Air Force and the Cosmonaut Corps in 1993.Svetlana is now a member of the State Duma representing the Communist Party of the Russian Federation. She also serves as the Deputy Chair of the Committee on Defense.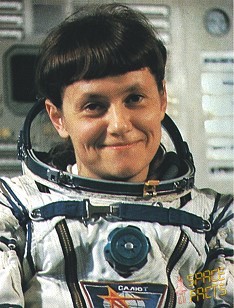
Svetlana Savitskaya (Credit Ria Novosti) In a 2009 interview Svetlana, somewhat unsurprisingly, revealed that she battled sexism during her career in the Russian Air Force and within the Cosmonaut Corps. She noted that the ‘Missions were tough,’ and that ‘Even among our space colleagues the men wondered why we needed to weld and said that we might burn each other’s space suits, or the spaceship’s exterior. It’s a great responsibility. My spaceflight shut everyone up!’
Svetlana was twice awarded the Hero of the Soviet Union and has two asteroids named for her (4118 Sveta and 4003 Savitskaya), and her record of 2683 km/h in a MIG-21 in the female category remains unbroken.
Svetlana Savitskaya quote:
“When watching the Earth from over there, one can see the results of human activities, not just a beautiful bluish habitable planet, but because one can see just how habitable it is, with all of its floodlit streets and avenues, and its huge cities. One can see this both at night and in the daytime. And secondly, anyone over there, in orbit, should give, and actually gives, a thought to the fact that they are at an average altitude of 400 kilometres, aboard a space station or a spacecraft that have been manufactured by human mind and human civilization, so one can’t help but feel proud of them. One realizes that this planet is their home. One may even land on water, somewhere in the world Ocean, still the planet is their home. One has a natural psychological wish to return to earth, to their home. When in orbit, one thinks of the whole of the earth, rather than of one’s country, as one’s home.”
-

It’s a small world after all
What we know of exoplanets has developed at the same time as the technology which we use to discover them. This is, in my opinion, the most exciting thing about the entire field of study. For instance, when we first started spotting planets around alien suns, we found huge gas giants. Hot jupiters, extremely massive and close to their parent stars. For a while, some conjectured that this type of planet may be quite common in the Universe. But since then, we’ve developed more powerful methods of searching the sky and, as it turns out, smaller planets are much more common than huge superjovian worlds. The latest piece in the puzzle comes courtesy of NASA’s Kepler space teescope. Near the end of last month, NASA announced the discovery of the smallest exoplanet ever found around a sun-like star!
Kepler-37b really is tiny. In fact, the whole Kepler-37 system is tiny – the entire system discovered so far can fit inside the orbit of Mercury! The innermost little world is under 100th the mass of Earth, it’s expected to have a radius of around 3867 km (assuming the same average density as the planets in our own solar system) making it smaller than Earth’s moon. One can only apprehensively wonder if this will spark yet another debate over how large an object has to be before it’s considered a planet. With such a tiny orbit, it also has a year lasting just 13 Earth days. Even though the star Kepler-37 is slightly smaller and cooler than the Sun, it’s still enough to heat the surface of tiny 37b to a roasting 700 Kelvin (nearly 430°C). Needless to say, while we all like stories which talk about potential alien life, this is unlikely to be a home for any lifeforms we might recognise.
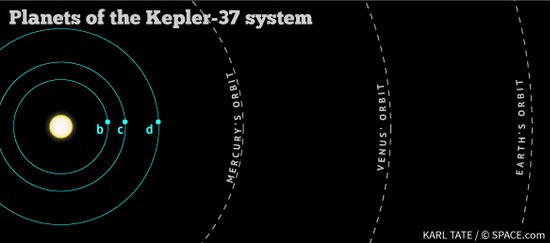
Kepler-37b is very definitely the runt of the litter. Its sibling worlds, denoted by the letters c and d, are respectively slightly smaller than Earth and about twice the size of Earth. Of course, these planets are also very close to their parent star. The interesting thing is that we’re discovering more and more small worlds around other stars. More and more exoplanet astronomers are warming to the idea that small rocky planets are likely to be the most common in our galaxy. Our current technology might have trouble spotting them further than a certain distance from their parent stars, but they’re likely to be out there waiting to be found.
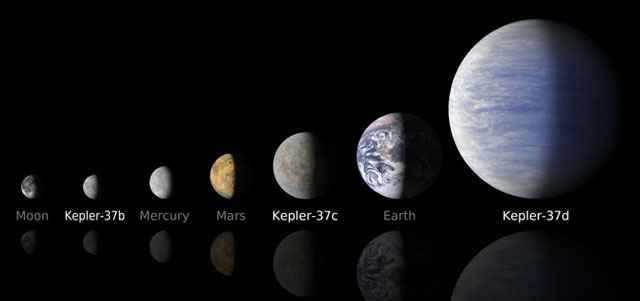
Even detecting Kepler-37b was quite a notable feat. It was only possible, in fact, because of a set of rather special circumstances. The star Kepler-37 is particularly quiet, lacking the noisy sunspots and features which cause brightness variation in most stars, making it a particularly clear target. It’s also relatively bright in Kepler’s field of view.
To learn more about this star, and hence get greater accuracy on the measurement of the planets it carries in tow, NASA astronomers used a technique known as asteroseismology. Not dissimilar to the way geologists measure earthquakes, asteroseismology is the study of vibrations within a star, measured by accurately observing pulsations in the star’s surface. All stars are constantly bubbling and boiling, and this causes the whole star to vibrate at a number of resonant frequencies – soundwaves – in exactly the same way a bell vibrates when it rings. By measuring the precise frequencies of those soundwaves, a lot can be determined about the interior of a star. Incidentally, this same technique can be used to effectively “listen” to the Sun.
Interestingly, because Kepler-37 has such an eerily peaceful surface for a star, it was very easy to measure those vibrations, making Kepler-37 the smallest star ever to be studied this way. Normally, only large stars are observed using asteroseismology because the measurements need to be very precise. Conveniently though, the Kepler telescope was built for breathtaking precision.
A tiny planet discovered orbiting a singing star 215 light years away. How poetic!
Image credits:
Top – NASA/Ames/JPL-Caltech
Middle – Karl Tate/ © space.com
Bottom – NASA/Ames/JPL-Caltech -

Weekly Science Picks

Google celebrated International Women’s Day with a Doodle
Source: GoogleWomen. This is the theme of this edition of Weekly Science Picks. Yesterday, in case you missed it, was International Women’s Day. And it is important to note the achievements of women in careers such as teaching, neuroscience and engineering because women are still in a tightly contested race with the male counterpart. But who doesn’t enjoy a little competition?
The articles selected this week touch on another issue that is being hotly debated in the U.S. as of late – the question of if women can have it all. Many of you have perhaps heard that Sheryl Sandberg, COO of Facebook, has started down a path of empowering women with her new book released this week, “Lean In: Women, Work, and the Will to Lead”, accompanied by the creation of Lean In Circles, a social networking group to help women express issues of dealing with work and family. I’m not going to get into a debate about this right now, except to encourage some discussion of this topic among our readers, female or male, and think how it applies to life in the sciences.
This first pick deals with exactly this topic. It is a selection of women in science from around the globe, tackling incredible and exciting challenges in the lab, and outside of it with families.
From the frontline: 30 something science, What’s being female got to do with anything, ask the scientists who are starting labs and having kids by Heidi Ledford, Anna Petherick, Alison Abbott & Linda Nordling
“I never thought that my life had to be limited to anything, and I want to set that example for my daughter.
-

Asteroids, extinctions, and biodiversity: Wiping the slate clean for new life to flourish
The recent meteor strike in Russia has been a rather sobering reminder that Earth has been regularly battered during its history, by space rocks. Actually, the amount of meteoritic material constantly landing on Earth is startling – on average, over 100 tons every day which we don’t even notice. Now, most of that is in the form of tiny rock fragments and dust; with most being small enough to be vapourised as they burn up in Earth’s atmosphere, relatively few meteorites ever end up on the ground. The part which may make us uneasy, however, is the fact that occasionally something larger crosses Earth’s path. Something much larger.
We already know with some degree of certainty that a gigantic asteroid impact may have played a role in wiping the dinosaurs off the face of our world, and we also know it’s not the only such large impact in Earth’s history. Now there’s evidence of another huge impact – and this one was in Australia!
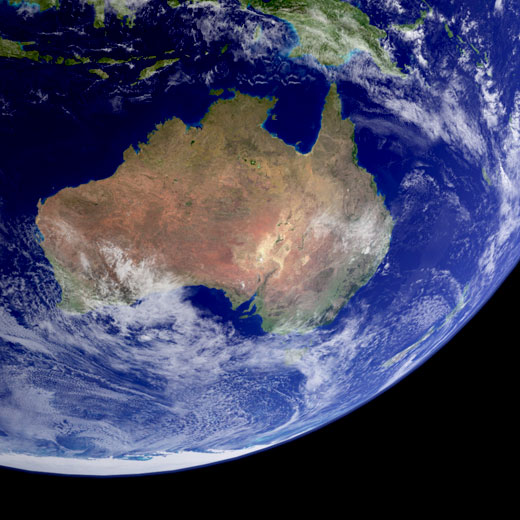
With a diameter spanning around 200 km in South Australia’s East Warbuton basin, an ancient impact site has been uncovered. Created by an asteroid which was probably between 10-20 km in diamater, affecting an area of terrain of around 30,000 km, this impact zone is the third largest currently known. When this particular asteroid struck Earth some 360 million years ago, its effects would have been profound and global.
Andrew Glikson, a visiting fellow at the Australian National University, first started investigating the area after hearing about structural abnormalities in the rocks there. He spent time in a crystallography lab, studying the orientation of crystals in rocks collected from the site, and found that the most likely cause for what he was seeing was the result of the rocks being subjected to a huge shock. Given the extent and area of the shocked rocks, the most likely explanation is a giant extraterrestrial impact.
The most well known giant impact, known as the Chicxulub Impact Event, occurred about 66 million years ago causing the Cretaceous-Tertiary extinction event, and quite probably being the final nail in the coffin of the dinosaurs. This newly discovered Australian impact site, however, is much older. In fact, when this asteroid struck Earth, it was around 100 million years before any dinosaurs had even evolved. In fact, it would have likely been during the Carboniferous Period in Earth’s geologic history. Interestingly enough, there was a minor extinction event during the Carboniferous. A minor extinction caused by a change in Earth’s climate.
Glikson went on to explain that this impact was likely one of part of a cluster which caused a number of impacts around that time. This cluster of impacts was very likely behind an extinction event. Simply, a huge impact like the one discovered in the middle of Australia would cause devastation. The effects locally would be severe, splattering molten rock into the air which would then rain back down to the ground hundreds of kilometres away, and a blast wave of superheated air would cause widespread forest fires near the impact zone – particularly in the oxygen rich atmosphere of Earth’s Carboniferous forests.
The global repercussions of such an impact, however, would be much worse. A huge amount of dust would be thrown up into Earth’s atmosphere, choking out the sunlight. This would cause Earth’s surface to cool, and the reduced light would make plants die off. A big enough impact – or a series of them – would throw enough dust into the skies that this could happen on a global scale. With the food chain cut off at the plants which are its source, a mass extinction would follow as animals would have trouble finding food to survive on.
These events are mercifully rare. A giant impact may happen on Earth once every ten million years or so. Interestingly enough though, researchers in a different study have found evidence that extinction events on planet Earth may actually be beneficial to biodiversity.
Kale Sniderman, part of a group of researchers working at the University of Melbourne and the University of Tasmania, focussed on an event much more recent than the East Warburton impact. Instead, he and the others looked at the last ice age, around one million years ago and together they constructed a hypothesis that extinction events may be even more important for biodiversity than rapid evolution. While their work concerns species which went extinct during ice ages as opposed to impact events, a suitably large meteor strike may be a factor in what causes an ice age to begin.
The traditional view of most biologists is that some areas have greater biodiversity due to evolution in those places progressing more rapidly. Evolution has always been the only thing emphasised in biodiversity studies, but Sniderman and his colleagues have taken the first step in overturning this picture.
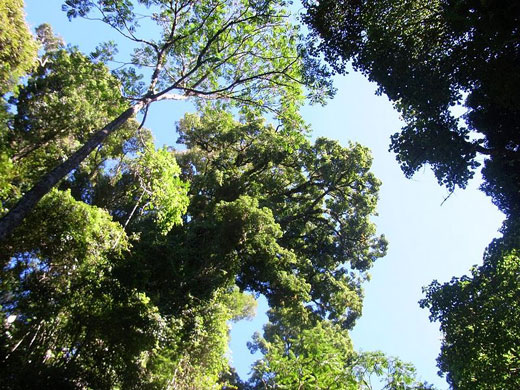
Their work looked at regions in South Africa and Australia – notable as two of the most diverse areas on planet Earth. South Western Australia is known among botanists for having a huge variety of plants, particularly tough leaved shrubs and trees. The very tip of the South African cape is even more diverse, populated by very similar types of plant. For a long time, biologists have theorised that the diversty in these rather similar areas was down to the dry, arid summer conditions and the nutrient poor soils in these areas. The exact connection, however, has never been entirely apparent.
As it happens, the status may not be quite so quo here. Studying fossils from an ancient lake in South Eastern Australia, it was found that plant life in Australia tended to die off as the continent has gradually become drier – a process taking millions of years. In particular, during the last ice age, a huge amount of rainforest plants died off. This allowed other hardier plants to fill the space they’d left and plant diversity expanded as they did so – creating what was described by University of Tasmania’s Greg Jordan as “a remarkable number of tough-leaved, shrubby plants.” Thinking about this process logically, it seems to make perfect sense. In any place on Earth where there’s a vacant ecological niche, life will typically evolve to try and fill that niche. Where an extinction occurs, a huge niche will suddenly become empty. This would prompt a veritable explosion of new life forms to fill in the gap.
This study not only gives new insight into how extinction events can affect diversity of life forms, but also has implications for current and future climate change, and how species may be able to cope with it. As I mentioned previously when talking about the Great Barrier Reef, Australian wildlife is already suffering from climate change. However, at least for plant life on land, there’s a good chance that the species most easily affected by rapid environmental changes may have already died off during the last ice age.
To loop this discussion back to the beginning, if an extinction due to an ice age could help to boost biodiversity, logically an extinction due to an asteroid impact event could do the same. To my knowledge, there are no studies in this context concerning what happened to biodiversity after the Chicxulub impact event (though I’ll admit that I may be wrong on this), but it would be very interesting to see what such studies might find. Similarly, it would be interesting to know if any such flourishes of biodiversity occurred after the newly discovered East Warbuton impact too. It could be that only certain types of extinction event can boost diversity of life on a planet. That said, if the same thing can occur after an asteroid impact then it may have implications reaching beyond Earth.
If a giant impact event could serve to actually boost life on a planetary scale, then it may imply that once life has taken hold on a planet, it’s more robust than we’ve been giving it credit for. The implications for astrobiologists and the search for life elsewhere in the galaxy are quite clear.
To end on an aside, a large enough asteroid strike even on Earth today would cause widespread fires kilometres away from the impact site. Back in the Carboniferous Period, around the time when the East Warbuton impact occurred, the situation would have been much more dramatic; the oxygen content of Earth’s atmosphere was up to 15% higher then, than it is today. In such a combustible atmosphere, where fires could have been started by a simple lightning strike, a large asteroid impact could cause a widespread inferno. However, South Africa (one of the places considered in the biodiversity study) is home to a number of species which have evolved specifically to survive fires. In particular, the highly diverse Fynbos region is known for a number of plants for which fire is actually an integral part of their lifecycle. Some seeds belonging to protea species simply don’t germinate unless they’re exposed to the intense heat of a wildfire. Provided they could gather sufficient amounts of sunlight under the darkened skies, plants like these may be able to rapidly repopulate an area after an impact event.
Life on Earth, evidently, has resilience which can still surprise us.
Image credits:
Top – Artists impression of a large scale impact event – Don Davis/NASA
Upper Middle – Australia seen from orbit – NASA
Lower Middle – League Scrub sub tropical rainforest, near Bowraville NSW, Australia – Peter Woodard/Wikimedia Commons
Bottom – Garden – https://croatia-real.estate -

The Story of a River
Every now and then you do a lesson that sticks. ‘The Story of a River’ is a simple interactive demonstration lesson, yet it provides a provocative view on environmentalism and sustainable practices. The original version “Who Polluted the Potomac
-

The Contagion of Violence
When Professor Plum killed Dr Black, in the library, with the candlestick it was for no other reason than murder is a disease. Murder is infectious and the contagion of violence is everywhere.
Violence begets violence.Violence within nations and cultures. It occurs within families and between partners. It increases the risk of violence directed at children and increases the risk of the children behaving violently themselves. Violence within a community perpetuates and spreads. Children catch it from their parents, and parents can catch it from their children. Violence is highly contagious in all respects it seems.
It was a 2012 essay by L. Rowell Huesmann that sparked off a study, appearing in Justice Quarterly. A study with a simple premise and question; if homicide is infectious, it should diffuse through communities, infecting those susceptible, and that diffusion should be detectable. Much in the same way we can track the flu from year to year, we can track the spread of murder as an epidemic. It offers an interesting way of looking at murder and homicide.
Welcome to Newark, New Jersey. A city that houses roughly 277,000 people has a homicide and murder rate over three times greater than that of anywhere else in the US. There were 104 murders and 504 shooting victims in 2006 alone. Firearms were used in 71% of the 380 reported murders in 2011. Suffice it to say, Newark is not a safe place.
The study took a look at how murders and homicides moved and behaved over a 26-year period (1982 to 2008) across the city. Firearms and gangs were the infectious agents; spreading from within the centre of the city and spreading south-westerly over the course of nearly three decades.
Their main argument is that the way murders move across a community is not random. The elements required for disease to propagate itself may be relevant and can be applied to the movement of homicide. And if this is so, then it can be predicted and controlled.
If you take a look at a map of Newark it is hard to see a pattern. Homicides occurred in all parts of the city. Almost the entire city appears to be a hot spot for murder. But analysis over the decades suggest that there was expansion of overall homicides between 1982 and 2008 with a dip in 1997 and a sharp rise in 2000. And highlighted an area of the city (North and East) that seemed largely immune to the spread of homicide. Indeed, murder was on the move.
The criminal justice system seeks to prevent murder, but only after the fact — by deterring those that do it with the penalty that awaits them after the fact (jail and criminal prosecution). Indeed, police forces already have an eye out for certain hotspots within a location. Areas where violence is known to spark and ignite at any given moment. What they don’t know is where it will go next. The authors of the study model homicide as an infectious disease as simply a way to offer instructive understanding of how homicide works. The most telling application of this non-literal model is the fact that for homicide to spread as a disease, a population susceptible to transmission must be present. Just like every other infectious agent, except this time poverty and social inequality replace a population with no herd immunity.
Image — source
-

Postcard from Spitzer: weather on 2M2228 is hot and cloudy
Long distance weather reports are now a commonality. The report for 2MASSJ22282889-431026 is somewhat unusual. It forecasts wind-driven, planet-sized clouds, with the light varying in time, brightening and dimming about every 90 minutes. The clouds on 2MASSJ22282889-431026 are composed of hot grains of sand, liquid drops of iron, and other exotic compounds. Definitely not the first place to spend a summer holiday.
Not that 2MASSJ22282889-431026 (or 2M2228 as it is known in The Astrophysical Journal Letters) will appear on a travel itinerary anytime soon. For 2M2228 is a brown dwarf, 39.1 light years from earth. Brown dwarves form out of condensing gas, as stars do, but lack the mass to fuse hydrogen atoms and produce energy. Instead, these objects, which some call failed stars, are more similar to gas planets, such as Jupiter and Saturn, with their complex, varied atmospheres. Although brown dwarves are cool relative to other stars, they are actually hot by earthly standards. This particular object is about 600 to 700 degrees Celsius.
The atmosphere of 2M2228
Astronomers using NASA’s Spitzer and Hubble space telescopes have probed the stormy atmosphere of this brown dwarf, creating the most detailed “weather map” yet for this class of cool, star-like orbs. “With Hubble and Spitzer, we were able to look at different atmospheric layers of a brown dwarf, similar to the way doctors use medical imaging techniques to study the different tissues in your body,” said Daniel Apai, the principal investigator of the research at the University of Arizona in Tucson.
But more surprising, the team also found the timing of this change in brightness depended on whether they looked using different wavelengths of infrared light.

This artist’s illustration shows the atmosphere of a brown dwarf called 2MASSJ22282889-431026, which was observed simultaneously by NASA’s Spitzer and Hubble space telescopes. The results were unexpected, revealing offset layers of material as indicated in the diagram. For example, the large, bright patch in the outer layer has shifted to the right in the inner layer. The observations indicate this brown dwarf — a ball of gas that “failed” to become a star — is marked by wind-driven, planet-size clouds. The observations were made using different wavelength of light: Hubble sees infrared light from deeper in the object, while Spitzer sees longer-wavelength infrared light from the outermost surface. Both telescopes watched the brown dwarf as it rotated every 1.4 hours, changing in brightness as brighter or darker patches turned into the visible hemisphere. At each observed wavelength, the timing of the changes in brightness was offset, or out of phase, indicating the shifting layers of material. Image credit: NASA/JPL-Caltech. These variations are the result of different layers or patches of material swirling around the brown dwarf in windy storms as large as Earth itself. Spitzer and Hubble see different atmospheric layers because certain infrared wavelengths are blocked by vapors of water and methane high up, while other infrared wavelengths emerge from much deeper layers.
The new research is a stepping-stone toward a better understanding not only of brown dwarves, but also of the atmospheres of planets beyond our solar system.
Into the red: the Spitzer space telescope
The Spitzer Space Telescope is the final mission in NASA’s Great Observatories Program – a family of four space-based observatories, each observing the Universe in a different kind of light. The other missions in the program include the visible-light Hubble Space Telescope, Compton Gamma-Ray Observatory, and the Chandra X-Ray Observatory.
The Spitzer Space Telescope consists of a 0.85-meter diameter telescope and three cryogenically-cooled science instruments which perform imaging and spectroscopy in the 3 – 180 micron wavelength range. Since infrared is primarily heat radiation, detectors are most sensitive to infrared light when they are kept extremely cold. Using the latest in large-format detector arrays, Spitzer is able to make observations that are more sensitive than any previous mission. Spitzer’s mission lifetime requirement was 2.5 years, then extended this to 5-years. Spitzer .
Launched on August 25, 2003 Spitzer is now more than 9 years into its mission, and orbits around the sun more than 100-million kilometers behind Earth. It has heated up just a bit – its instruments have warmed up from -271 Celsius to -242 Celsius. This is still way colder than a chunk of ice at 0 Celsius. More importantly, it is still cold enough for some of Spitzer’s infrared detectors to keep on probing the cosmos for at least two more years; the project funding has been extended to 2016.

Spitzer seen against the infrared sky. The band of light is the glowing dust emission from the Milky Way galaxy seen at 100 microns (as seen by the IRAS/COBE missions). Image credit NASA/JPL Spitzer is the largest infrared telescope ever launched into space. Its highly sensitive instruments allow scientists to peer into cosmic regions that are hidden from optical telescopes, including dusty stellar nurseries, the centres of galaxies, and newly forming planetary systems. Spitzer’s infrared eyes also allows astronomers see cooler objects in space, like brown dwarves, extrasolar planets, giant molecular clouds, and organic molecules that may hold the secret to life on other planets.
Instead of orbiting Earth itself, the observatory trails behind Earth as it orbits the Sun and drifts away from us at about 1/10th of one astronomical unit per year.
This innovative orbit lets nature cool the telescope, allowing the observatory to operate for around 5.5 years using 360 litres of liquid helium coolant. In comparison, Spitzer’s predecessor, the Infrared Astronomical Satellite, used 520 litres of cryogen in only 10 months.
This unique orbital trajectory also keeps the observatory away from much of Earth’s heat, which can reach 250 Kelvin (-23 Celsius) for satellites and spacecraft in more conventional near-Earth orbits.
More scientific duets: the asteroid belt of Vega
Like a gracefully aging rock star Spitzer is reveling in duets. It has also teamed up with the European Space Agency‘s Herschel Space Observatory. Using data from both astronomers have discovered what appears to be a large asteroid belts around the star Vega, the second brightest star in northern night skies.
The data are consistent with the star having an inner, warm belt and outer, cool belt separated by a gap. The discovery of this asteroid belt-like band of debris around Vega makes the star similar to another observed star called Fomalhaut. Again this formation is similar to the asteroid and Kuiper belts in our own solar system.

Astronomers have discovered what appears to be a large asteroid belt around the bright star Vega, as illustrated here at left in brown. The ring of warm, rocky debris was detected using NASA’s Spitzer Space Telescope, and the European Space Agency’s Herschel Space Observatory. In this diagram, the Vega system, which was already known to have a cooler outer belt of comets (orange), is compared to our solar system with its asteroid and Kuiper belts. The relative size of our solar system compared to Vega is illustrated by the small drawing in the middle. On the right, our solar system is scaled up four times. The comparison illustrates that both systems have inner and outer belts with similar proportions. The gap between the inner and outer debris belts in both systems works out to a ratio of about 1-to-10, with the outer belt 10 times farther away from its host star than the inner belt. Astronomers think that the gap in the Vega system may be filled with planets, as is the case in our solar system. Image credit: NASA/JPL-Caltech. What is maintaining the gap between the warm and cool belts around Vega and Fomalhaut? The results strongly suggest the answer is multiple planets. Our solar system’s asteroid belt, which lies between Mars and Jupiter, is maintained by the gravity of the terrestrial planets and the giant planets, and the outer Kuiper belt is sculpted by the giant planets.
“Our findings (accepted for publication in the Astrophysical Journal) echo recent results showing multiple-planet systems are common beyond our sun,” said Kate Su, an astronomer at the Steward Observatory at the University of Arizona, Tucson.
Vega and Fomalhaut are similar in other ways. Both are about twice the mass of our sun and burn a hotter, bluer color in visible light. Both stars are relatively nearby, at about 25 light-years away. Fomalhaut is thought to be around 400 million years old, but Vega could be closer to its 600 millionth birthday. For comparison our sun is 4,600 million years old. Fomalhaut has a single candidate planet orbiting it, Fomalhaut b, which orbits at the inner edge of its cometary belt.
The Herschel and Spitzer telescopes detected infrared light emitted by warm and cold dust in discrete bands around Vega and Fomalhaut, discovering the new asteroid belt around Vega and confirming the existence of the other belts around both stars. Comets and the collisions of rocky chunks replenish the dust in these bands. The inner belts in these systems cannot be seen in visible light because the glare of their stars outshines them.
It would seem that Spitzer has quite a bit more productive and novel scientific life, including duets, left in it yet.
-

Science Expo: Enrich, Empower, Explore
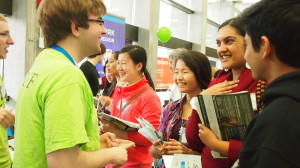
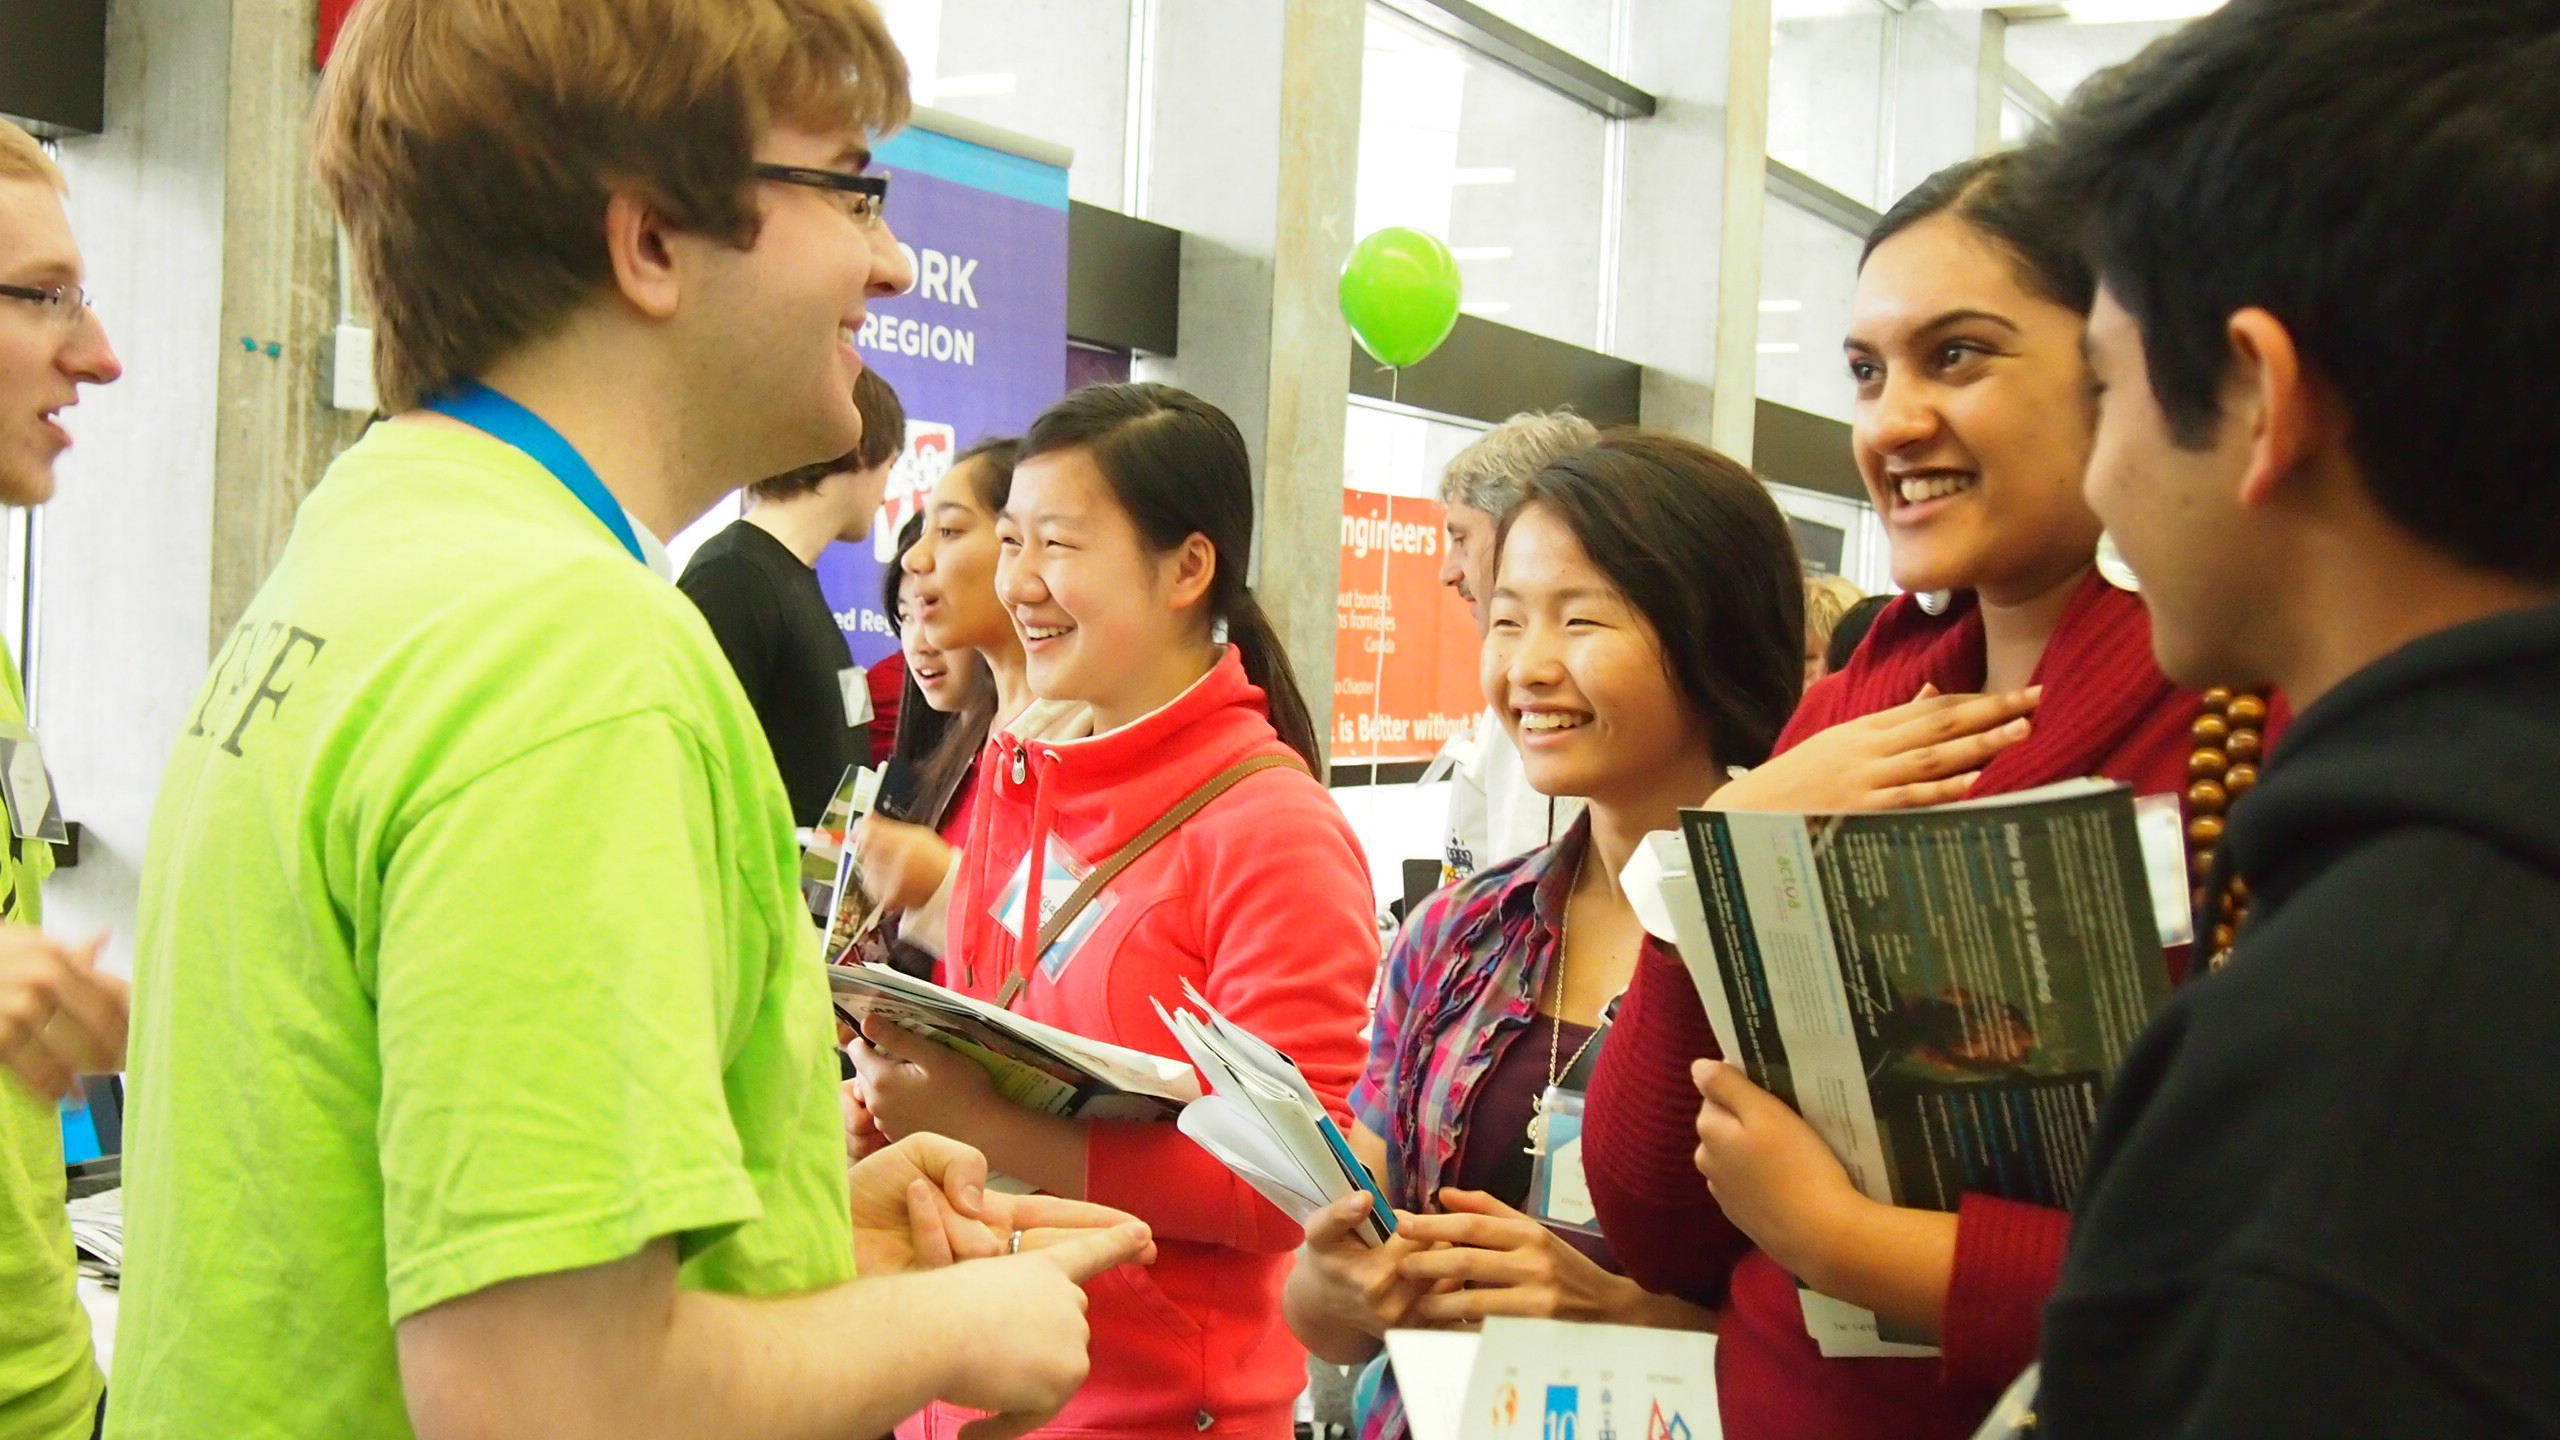
Students interact with enrichment exhibitors at Science Expo 2013: Derive and Integrate. The Science Expo Youth Empowerment Group (SEYEG) is a student run, non-profit organization which aims to connect youth to innovators and enrichment opportunities in science, technology, engineering and mathematics (STEM). SEYEG was founded by five students who met at the Canada-Wide Science Fair in 2009. In 2010, the first Science Expo, a 2-hour conference held in Guelph, Ontario, brought together over 200 students, teachers and parents. Today, SEYEG includes a student and teacher outreach program, an alumni mentorship program (EXPOtential) and a creative competition (meriSTEM) in addition to an annual conference.
Science Expo 2013: Derive and Integrate, Science Expo’s fourth annual conference, took place this past Saturday at the Ontario Science Centre in Toronto, Canada. The conference brought together over one hundred high-achieving students from across the province interested in pursuing STEM enrichment opportunities. With guest speakers, networking workshops and STEM challenges, the day was a huge success and the delegates returned home with a renewed passion for discovery.
The morning began with a delightful science magic show, where Mr. Chamberlain and Mr. Oslinger showed off their impressive comedic and chemistry skills. A literal ice breaker followed, in which delegates were challenged to melt a bag of ice as fast as they could without using body heat. Students were even seen holding ice to light bulbs in the ceiling!
During lunch, delegates were given the chance to interact with exhibitors from various STEM programs. Youth Science Canada, Shad Valley, the University Ontario Institute of Technology, Engineers Without Borders and Australian Science are a few of the organizations with which students could get involved.
Guest speakers this year included:
• Dr. Steve Mann, the father of wearable computing
• Dr. Brad Brass, co-recipient of the 2007 Nobel Peace Prize
• Paul Nazareth, business advisor
• Laura Suen, Canada’s Smartest Person, runner-up
Each presentation was inspirational and insightful, demonstrating important life lessons to attendees. Dr. Mann touched on the importance of thinking outside of the box when approaching a scientific concept, while Paul Nazareth and Dr. Bass illustrated the power of networking. Laura Suen mentioned the concept of happy accidents through the presentation of her past successes.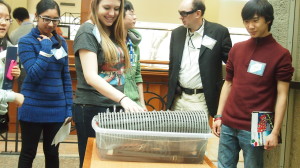
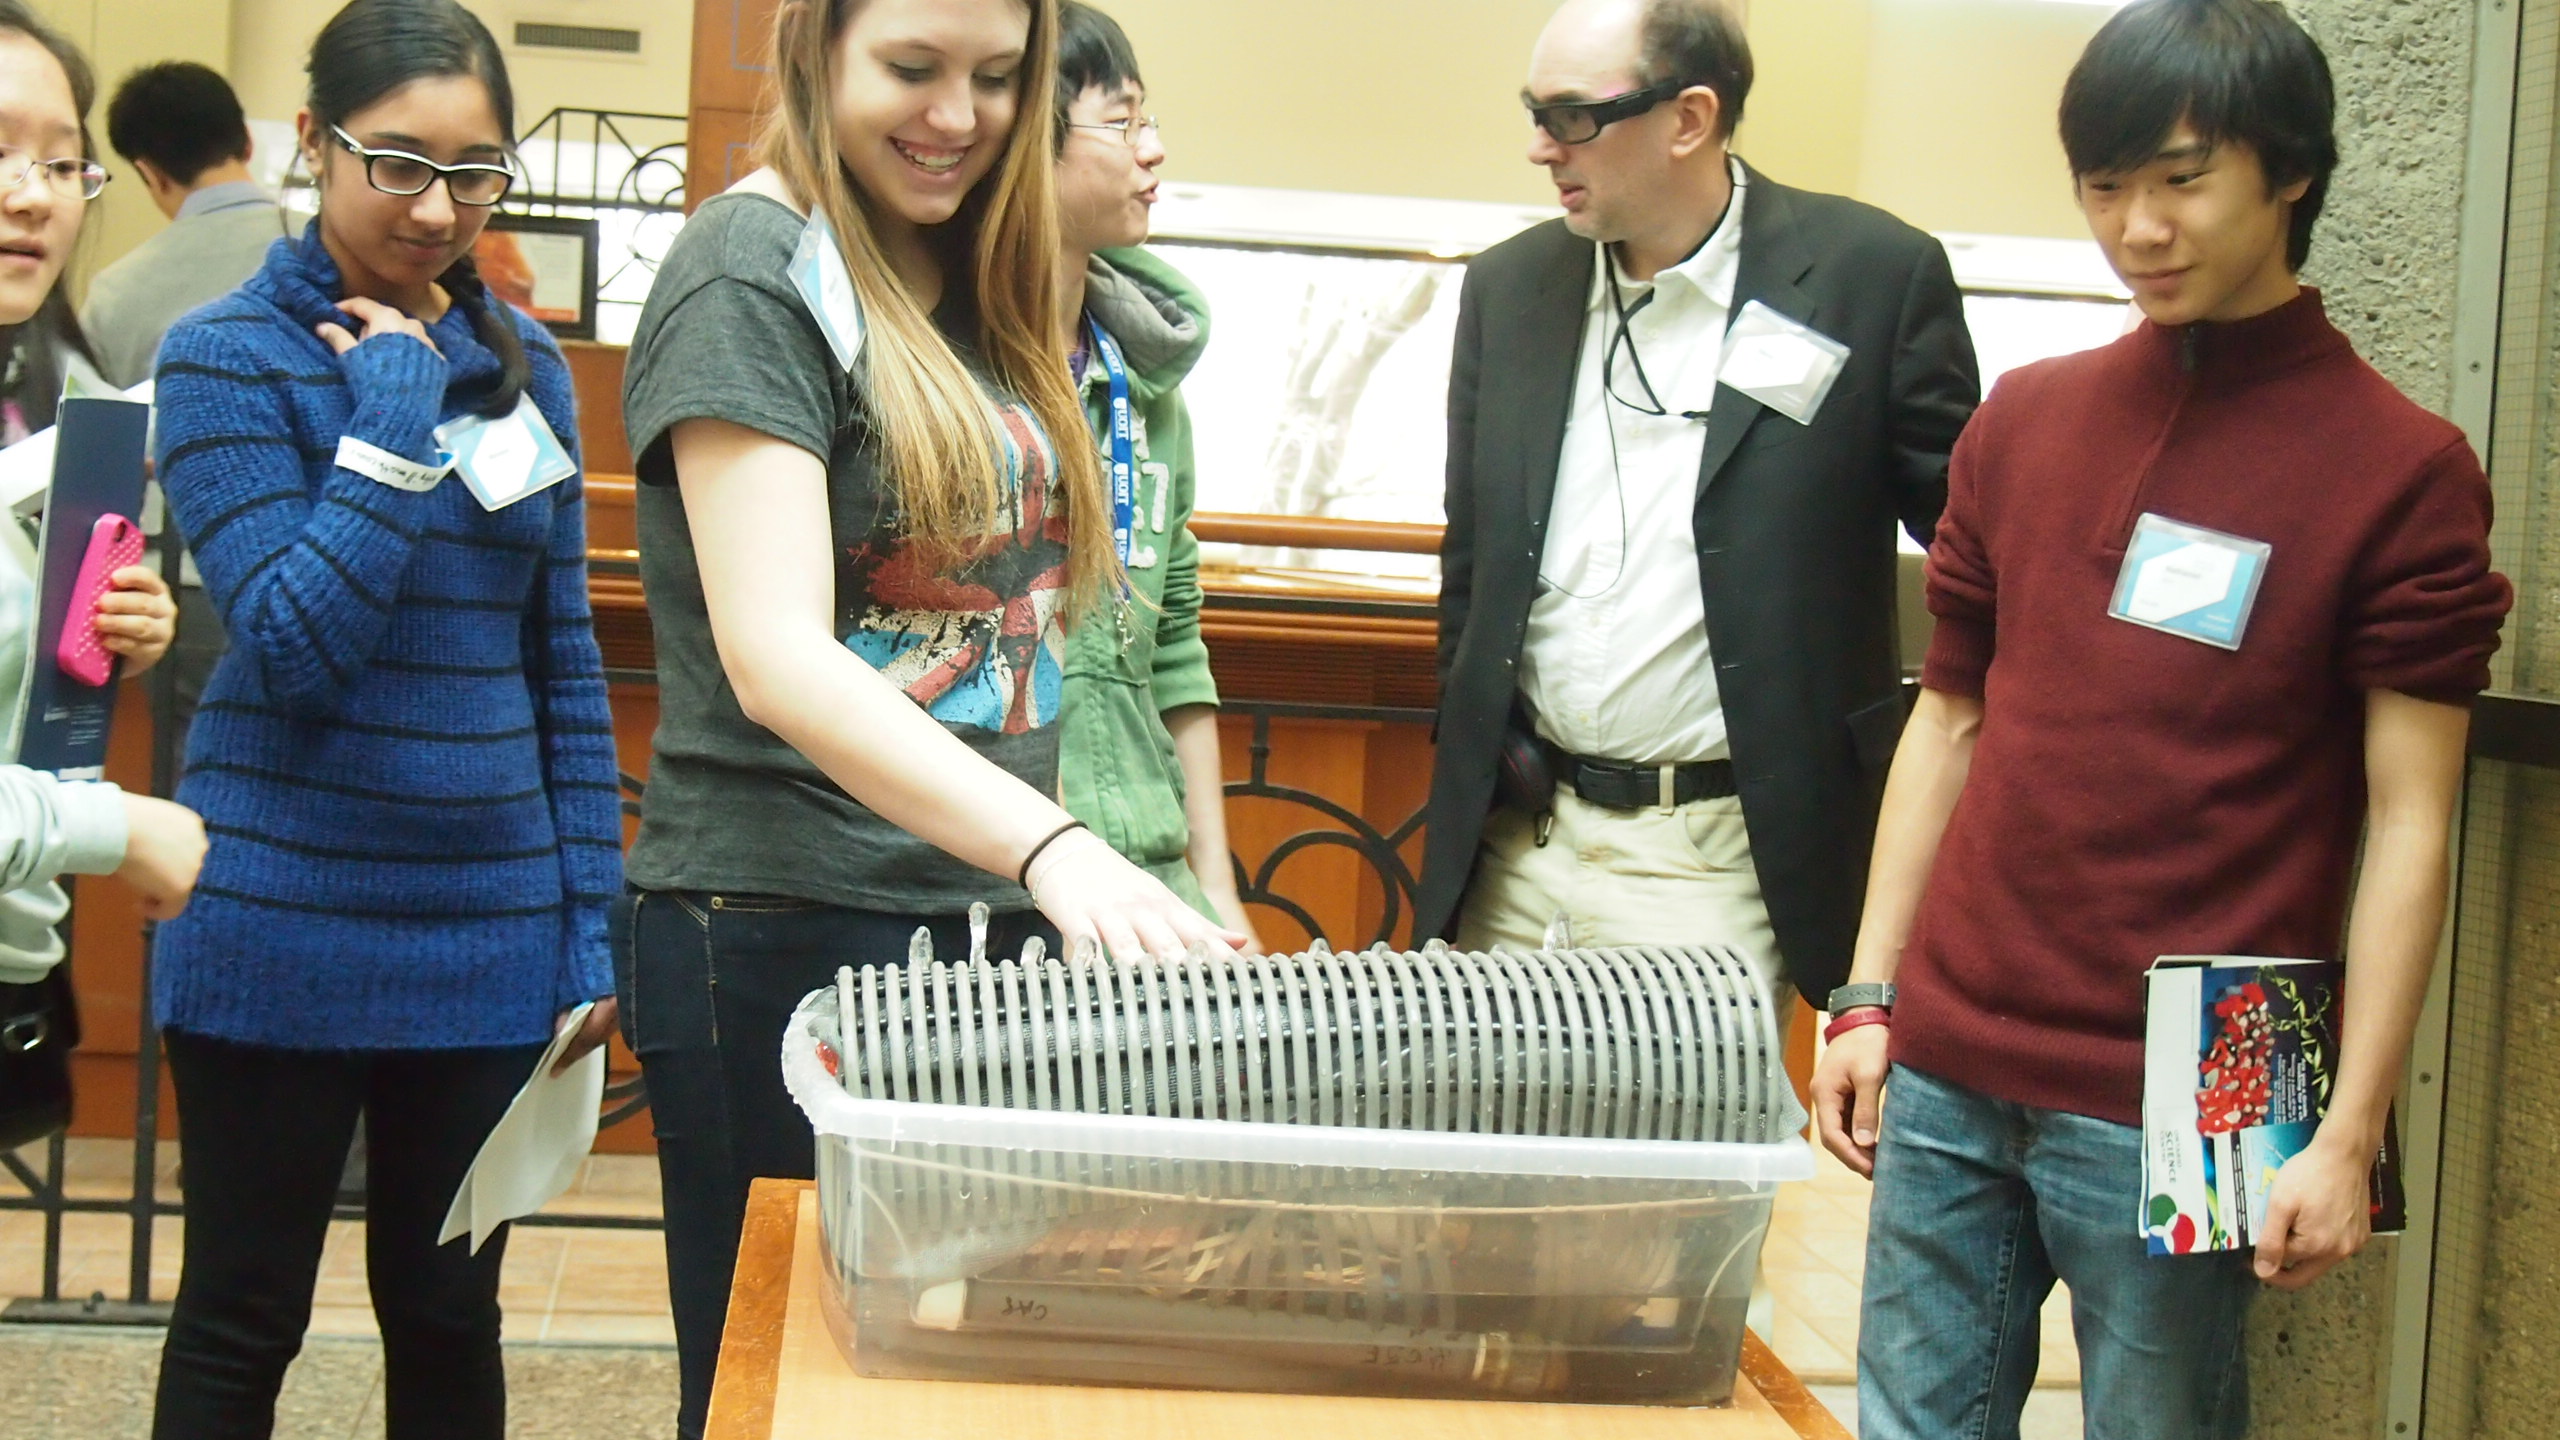
Delegates at Science Expo 2013 play with the Hydraulophone, a liquid instrument invented by Dr. Steve Mann. The day also included presentations from the finalists of the meriSTEM competition. In its foundational year, meriSTEM is a competition that allows participants to create anything which captures an interesting aspect of STEM. Five finalists presented these creative projects, with the winner receiving a $500 scholarship.
For more information on Science Expo’s initiatives and how you can get involved, please send an e-mail to info@science-expo.org or check out their website at www.science-expo.org . -

Weekly Science Picks
Welcome to some of this week’s best science happenings on the interweb space!
The first question is simple: can you name a female statistician? Epidemiologista answers its own question with a nice profile of Dr Janet Lane-Claypon: epidemiologic pioneer.
Can you name a female statistician?
“We read about statistics every day: be it the predicted winner of a football league, the association between the weather and mortality, or a newly discovered link between an inanimate object and cancer. Statistics are everywhere. And perhaps even more so this year, as 2013 has been hailed as the International Year of Statistics. Despite all this attention for numbers, we generally don’t know a lot about the people hiding behind their computers churning them out. With media attention for people like Nate Silver and Hans Rosling, some are now able to name at least one statistician, but, stepping it up a level, could you name a female statistician?